09 Feb 2016
We are excited to announce the latest update to our backtester. You can now easily evaluate strategies that you trade
only when implied volatilities are at certain levels, for example, writing SPY puts only when VIX is greater than 25
or selling Apple calls when implied volatility is greater than 35%. Setting up these strategies in Volatility only
takes a few clicks, and backtesting results will be displayed in just a few seconds. Try it now
(click on IV Range in Advanced Parameters).
Tags: updates • beta • options backtesting • implied volatility
02 Feb 2016
This is a big week for earnings, and we wanted to save you all a ton of time by putting together options market
expectations and average historical earnings price moves in one place.
A couple things caught our eye while putting the table below together:
- After all Chipotle has been through, the market is only pricing in just another average quarter
- GoPro implied vols are so high that sold straddles offer the rare 1:1 max risk / max reward ratio on a backtested basis
Expected moves are derived from options prices for 2/5/16 expiry. Click expected moves to backtest.
Average moves are historically realized day after earnings price moves.
Tags: options market analysis • earnings
26 Jan 2016
The scale at which Apple operates is mind-boggling – 75 million iPhones expected to have been sold in Q4 alone!
Having said that, the stock market has taken a cold shoulder to Apple with the stock selling off 20%
over the past six months.
The options market is pricing in a 6.6% move for Apple through Friday with Q4 results announced later today.
This expected move is on the high end of what’s normally expected for a holiday quarter. In 2015 traders priced in a 6.8% move, 2014 5.2%,
2013 7.2%, 2012 5.4%, and 2011 4.4%.
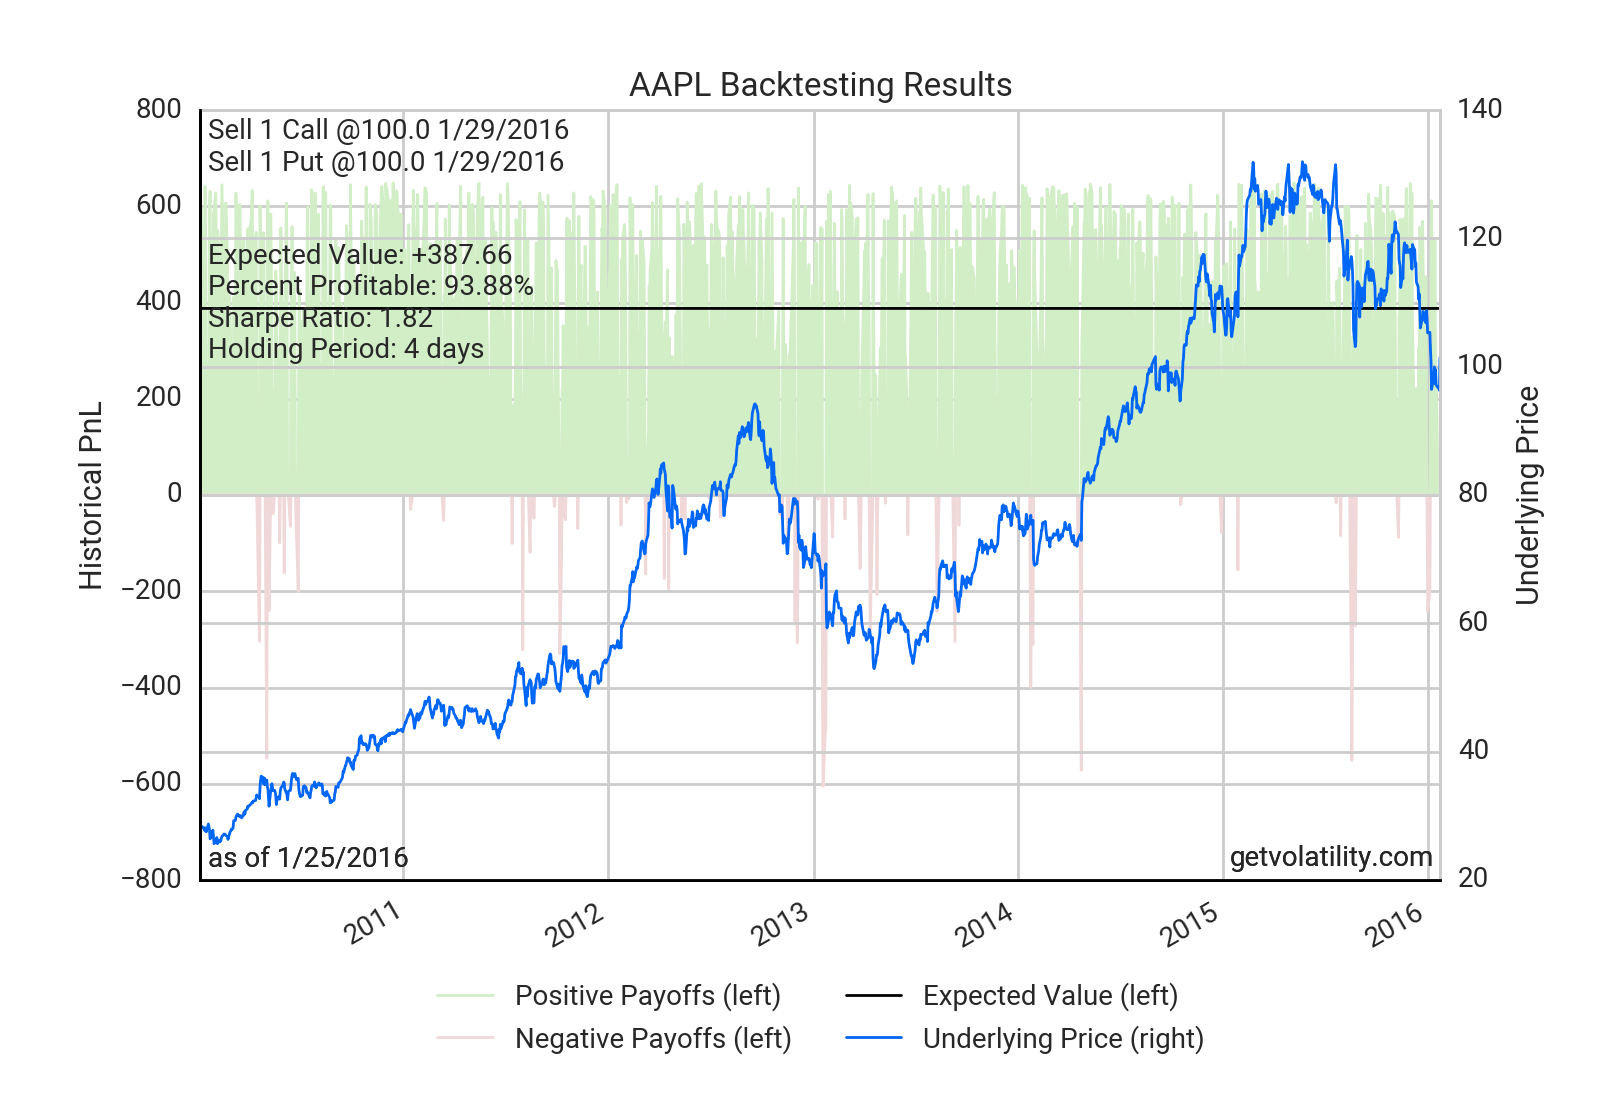
Selling the Jan 29 straddle is not for the faint of heart, but it
offers a nearly 1:1 risk/reward of max gain to max loss on a backtested historically realized basis since 2010.
The largest loss would have been after 2012’s Q4 results were reported in January 2013. Potential loss on a straddle is of course unlimited.
The chart below visualizes a backtest of selling the weekly AAPL straddle at today’s pricing. Volatility beta users can analyze the straddle trade further
here.
You are welcome to join our free beta if you don’t have an account.
Tags: options market analysis • earnings • AAPL
19 Jan 2016
Happy new year! We’ve been hard at work on new features and are excited to announce our latest big update to Volatility’s Backtester and a new design.
A backtester that’s twice as powerful
The new Backtester will help you rapidly answer two crucial trading questions for each trade. First, is the strategy
attractively priced today? And second, does it have persistent systematic edge over time? Use the new Calculation Method
setting to toggle between these two kinds of backtests.
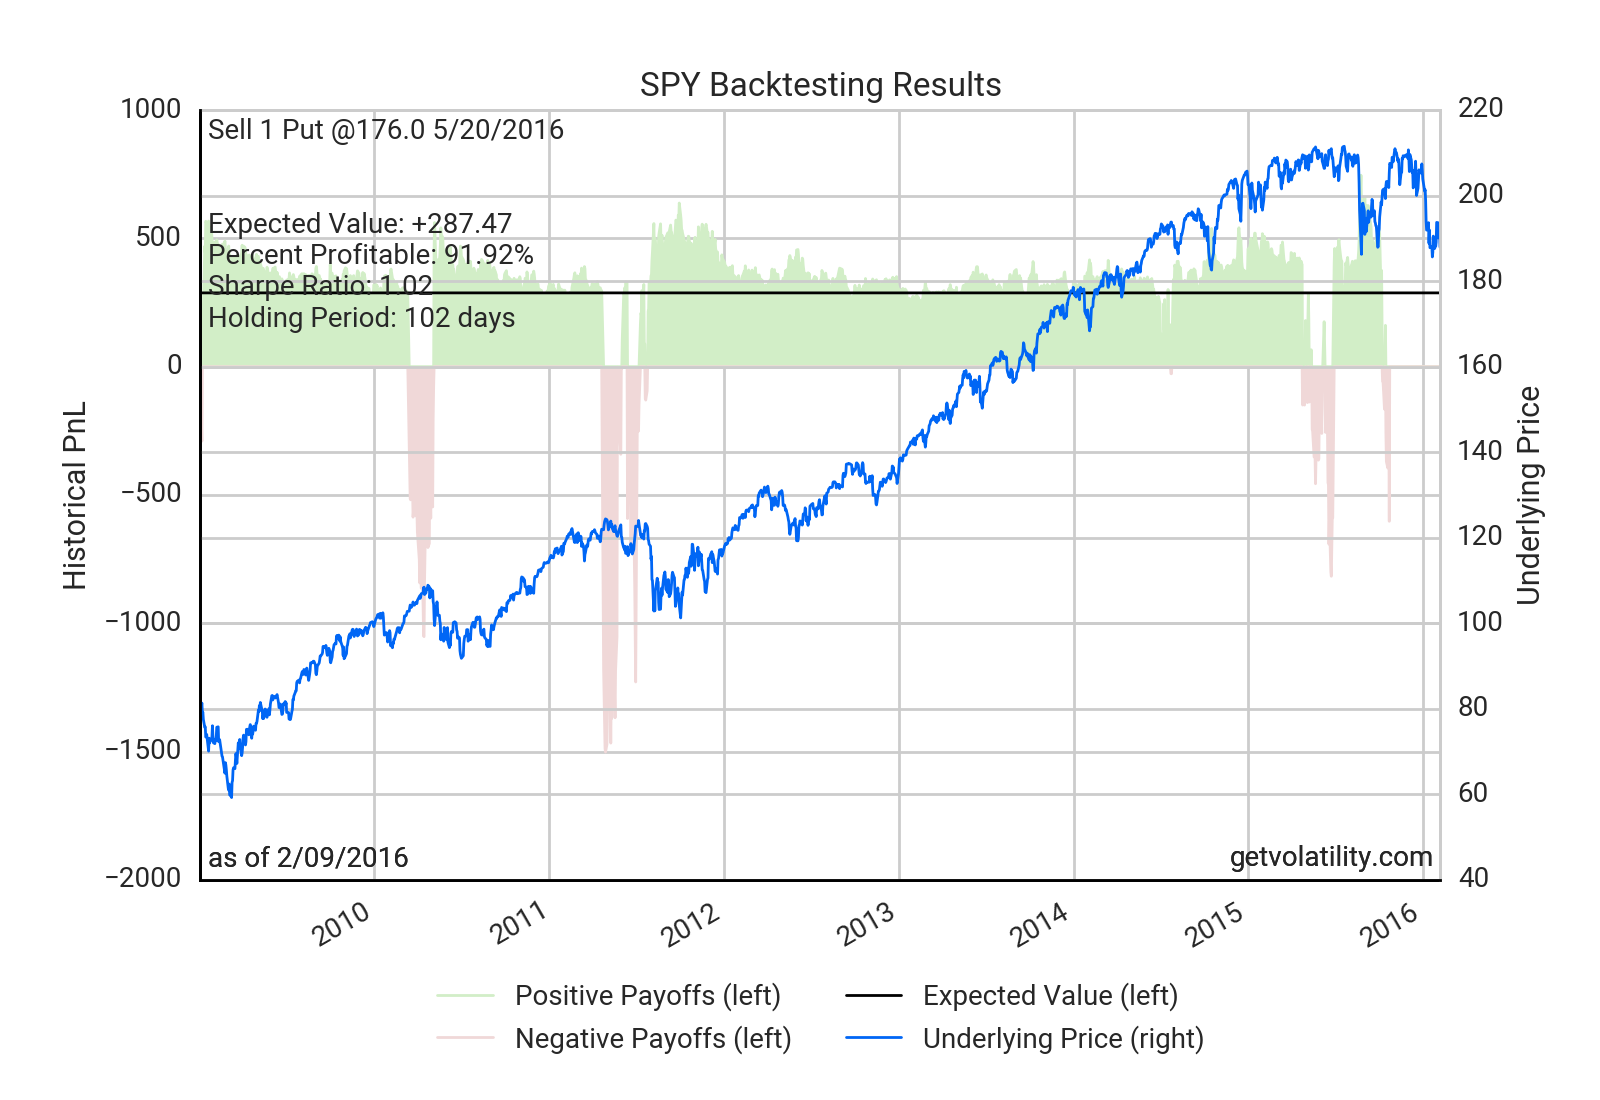
As an example, if I were looking to sell puts on the S&P 500, the “today’s prices” Calculation Method would show whether
pricing today is unusually attractive relative to history. The “systematic strategy” method would show whether selling
puts recursively performed well in the past. Both provide crucial insight into the potential profitability of my strategy.
Early users of the new backtester have noted that what previously took them hours in clunky spreadsheets now only
takes them seconds with Volatility. Try it now and tell us what you think.
Simpler workflows and site navigation
We have redesigned Volatility
to be more intuitive and make navigation more fluid and unified. The idea generation, backtesting, and charting pages
are now responsive tabs on the same page. Most important, we’ve also added a universal
Start bar, which with just a few keystrokes will launch any part of Volatility for any symbol from anywhere.
Of course, we also made everything cleaner and prettier.
We’d love to hear what you think of these updates.
Tags: updates • beta • options backtesting
15 Dec 2015
The last time the Fed seemed close to liftoff from zero rates, the Chinese stock market dropped sharply and fears of contagion
held the central bank back. This time around, we have cratering oil prices and scarily illiquid credit markets, but the Fed’s signaling
and strong economic growth have kept the futures market unfazed. Futures are currently pricing in a 76% chance of a hike Wednesday. We think it’s interesting
to look at what options are pricing in for market moves this week across equities, interest rates, and commodities to understand how much
the Fed decision might impact asset prices in the short-run.
Equities
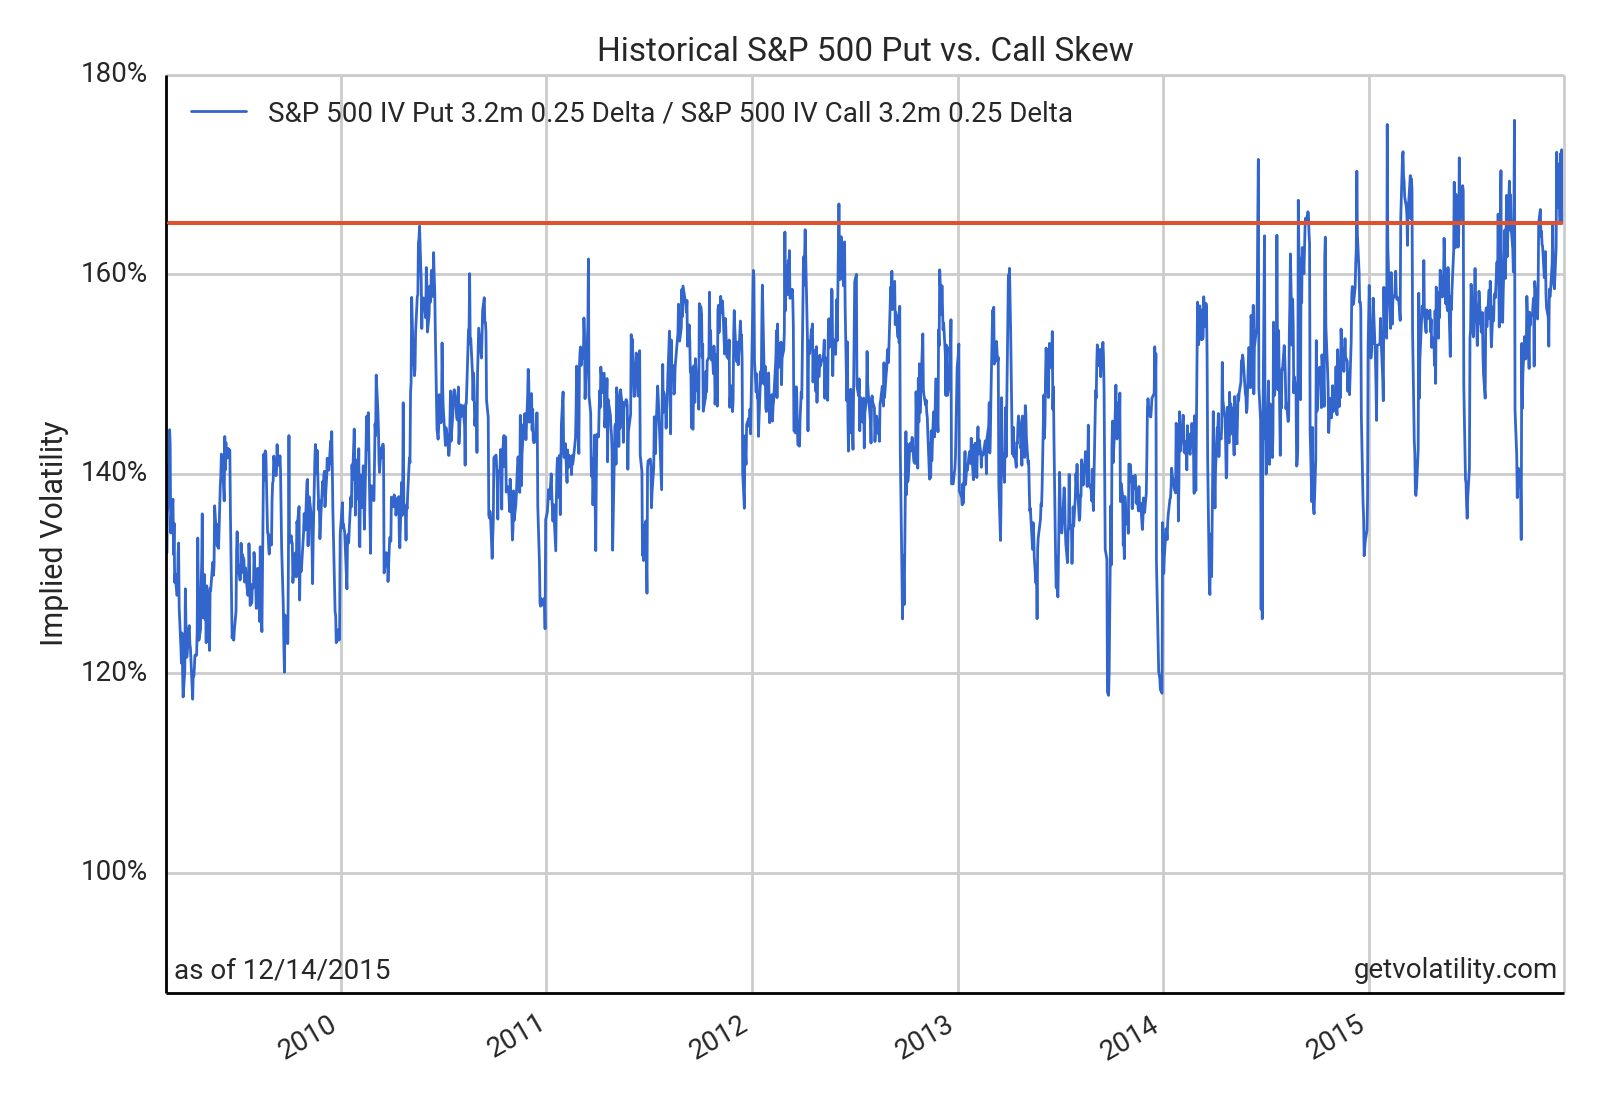
The options market expects a 2.4% S&P 500 move by Friday.
In the 206 weeks since 2012, only 22 have realized moves that large. A much larger 5% move is expected in Emerging Markets. Demand for put protection
relative to call upside is near the highest level since the Financial Crisis (illustrated with the S&P 500 skew chart below).
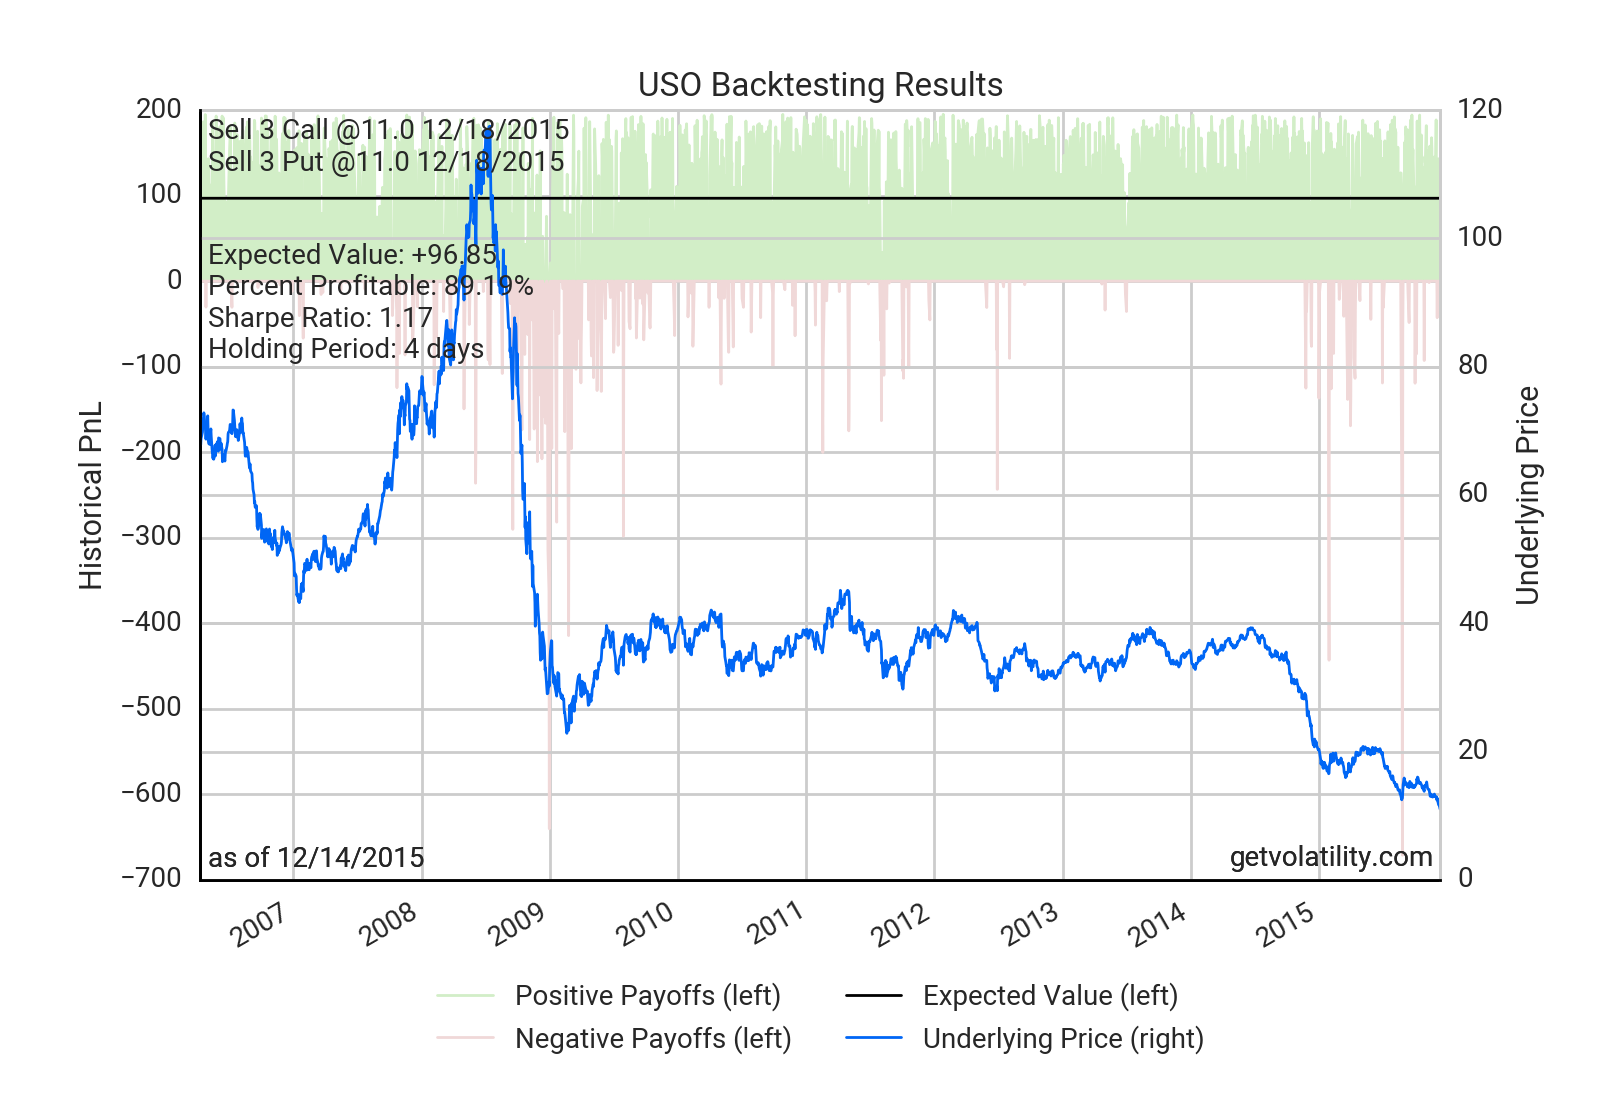
Crude oil
USO options are pricing in a 4.8% move by Friday.
Oil has moved less than that over four trading days 89% of the time since 2006 (backtest below) and 85% of the time over the past year.
High yield credit
High yield credit (HYG) has a 2.0% move by Friday priced in, a 90th percentile occurrence.
U.S. rates
U.S. 10y bonds currently yield 2.27% and options are priced for them to stay within 2.21%-2.33% by Friday.
Tags: options market analysis • Federal Reserve • interest rates • S&P 500 • oil • credit