22 Mar 2016
Strategy payoff grids added to every backtest
We are happy to announce our latest addition to Volatility. Forward-looking grids which show profit and loss
estimates by underlying price and time are now shown alongside every backtest. These intuitive grids make it
even easier to contextualize when your strategy will succeed and what risks you’re taking all the way through
expiry. You can also re-calculate the entire future payoff grid under custom implied volatilities.
Try it now.
Negative put selling expected value
Short-dated implied volatilities have compressed significantly over the past two weeks, so much so that
selling 1-month 5-10% OTM puts at today’s pricing now has negative expected value on a
historical backtest.
On the major indices, put sellers are collecting 45% less premium (on average) than just four weeks ago and 25%
less than the median over the past seven years. Premium sellers may be better served looking at select single names.
We highlight a few below.
Vols that remain high: Tesla (upcoming Model 3 unveil),
Hewlett Packard,
Activision Blizzard.
Historically attractive put-writes: S&P Biotech,
Nike,
Zoetis.
Historically attractive covered calls: LinkedIn,
Alibaba,
Viacom.
Interested in private beta access? Sign up here.
Tags: updates • beta • options backtesting • payoff grids • options market analysis
15 Mar 2016
Options traders are expecting an unusually low market impact from the Fed this week. S&P 500 options imply an expected
price range of $1989 to $2051 (1.6% move)
through Friday. Since 2009, 42% of weeks (159/377) had realized moves greater than 1.6%, and the average move across all
weeks was 1.7%. Is this really just going to be another average week?
Traders aren’t only expecting U.S. markets to be unusually sleepy. Short-term vols for the
euro,
IG corporate bonds,
Treasuries,
Euro Stoxx, and even
Chinese equities
are all sub-35th percentile over the past year. A whole host of macro and single-name
upside and
protection plays
that would have been prohibitively expensive just a few weeks ago are now tenable again.
Notable options markets
Vols that remain high:
S&P Metals and Mining,
Brazil,
CAD/USD.
Historically attractive put-writes:
Freeport McMoran,
Tesla,
S&P Biotech.
Historically attractive covered calls:
TripAdvisor,
GameStop,
Viacom.
Interested in private beta access? Sign up here.
Tags: options market analysis • Federal Reserve • S&P 500
08 Mar 2016
Our newest trading idea generation feature helps you quickly find related markets that may be better expressions of your
market view. Every Opportunities page now has a Correlated Markets section which lists macro and single-name equity markets
that move in tandem with the security you’re evaluating. This feature will get your creative juices flowing, and you will
likely discover other liquid markets that offer more attractive pricing for your view. Before you place your next trade,
make sure you check the correlated markets.
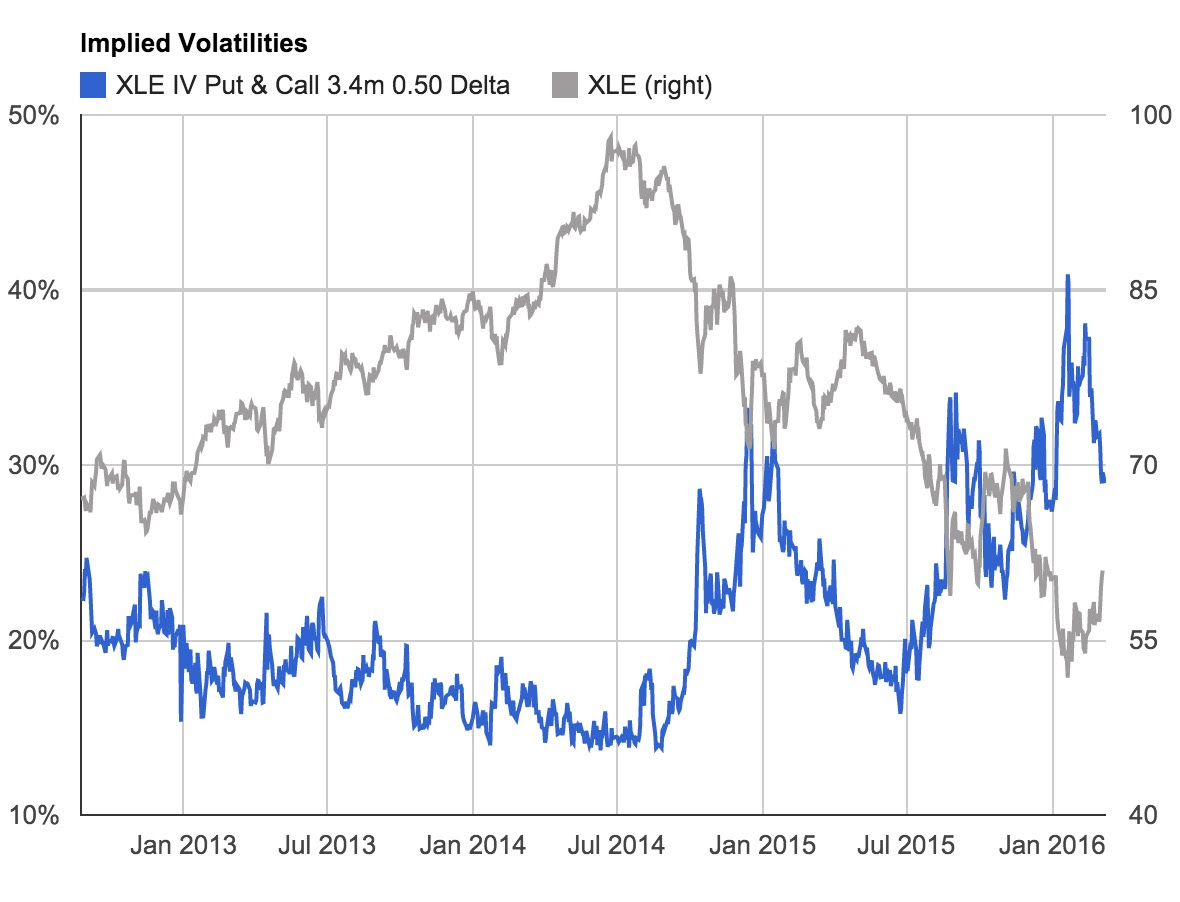
Revamped implied volatility charts
We have updated our implied volatility charts to overlay the price of the underlying market by default. We think this
makes it much more intuitive to contextualize current implied volatility levels with historical pricing.
Interested in private beta access? Sign up here.
Tags: updates • beta • correlation
23 Feb 2016
We are happy to announce two highly requested features today: 1) Put/Call Writing Screens
for weekly options, and 2) the ability to backtest strategies containing both options and underlying shares
or futures.
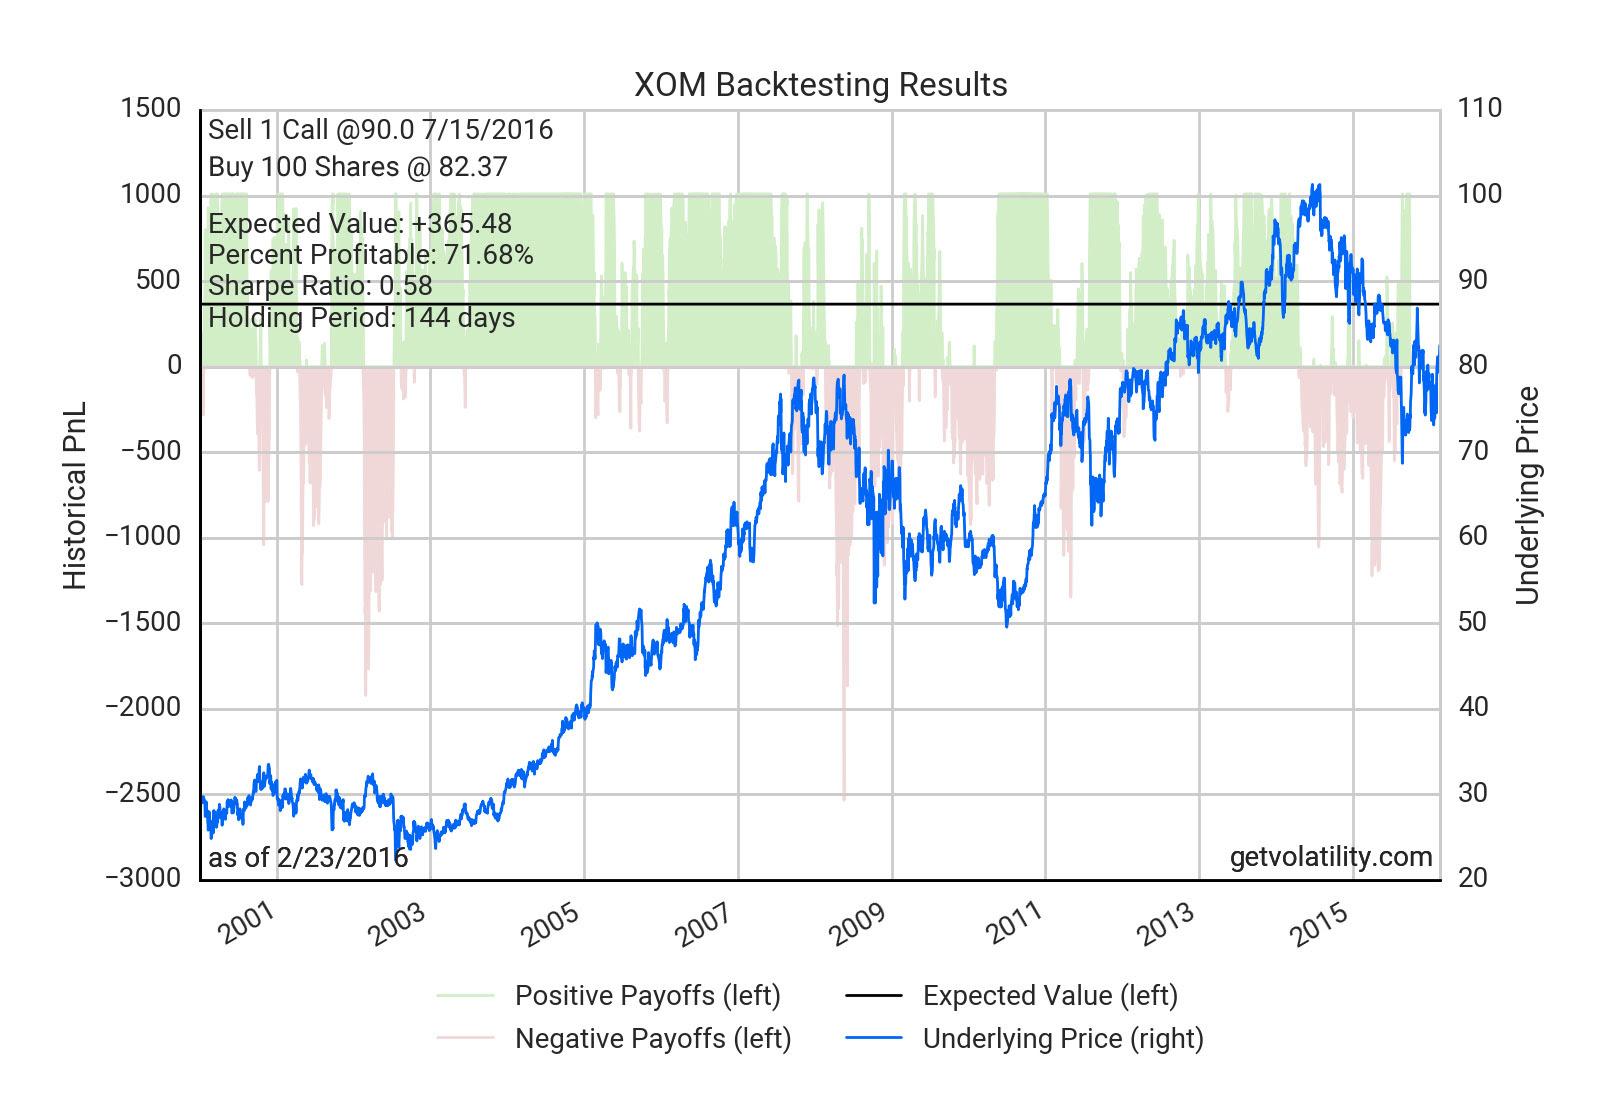
Backtesting
Many of the most popular options strategies are coupled with positions in the underlying market, and they are now
easier than ever to comprehensively backtest with Volatility. For example, you can determine in seconds whether
selling calls against your equity holdings could add to your bottom line or if put protection is unusually cheap
on holdings that concern you.
Here’s an example backtest
of owning 100 shares of Exxon coupled with selling 10% OTM call options. All of our core
backtesting functionality including early exit dates, IV range restrictions, and systematic calculation methods
have been updated to incorporate positions in the underlying market. Scenario Analysis and Payoff Diagrams have
also been updated.
Weekly Options Screens
Our screens are one of our most popular features, and we are excited to
now include weekly options opportunities. Select the “1w” choice in the tenor dropdown to view them.
Hint: For those of you that only want to see the shortest term opportunities in the Put/Call Writing Screens,
a handy trick is to sort by Days to Expiration ascending then sort by backtested Expected Value or Return on
Capital descending (shift click column headers to sort by multiple columns at the same time).
Interested in private beta access? Sign up here.
Tags: updates • beta • options backtesting • options screens • covered calls
09 Feb 2016
At popular request, we’ve put together another earnings guide this week. The table below summarizes
options market expectations and average historical earnings price moves for 12 major companies reporting this week.
A couple things caught our eye:
- Blizzard options price in an earnings move that’s more than 2x the historical realized average
- Baidu is the only name where options are pricing in a move less than the historical average
Tags: options market analysis • earnings