30 Jul 2018
99.9% stocks coverage
We are very happy to announce that we have expanded our backtesting universe with 600 new U.S. listed stocks
now available on our platform. This change increases our coverage from 99% of traded equity option volume to 99.9%! These
new stocks are of course also available in our screening tools such as our Macro, Equities, Put Writing, and
Covered Call screens as well as our statistical trading opportunities.
Design updates
Over the last few months, we have been releasing updates to our user interface and design to make our products
even easier to use. We’ve already received much positive feedback about these improvements. Please continue
to send us your comments and suggestions, and we’ll work diligently to implement them.
Tags: updates • options backtesting • options screens
05 Dec 2017
We are excited to announce a new feature which significantly broadens the capabilities of our backtesting tools. Our
Backtester provides you with unparalleled insight into the historical performance and risk of a single options
strategy. Our new Portfolio view takes these analytics to the next level by allowing you to backtest multiple
strategies encompassing a limitless number of trades all from one place.
As an example, in just a few seconds, you can backtest covered calls on a basket of U.S. technology stocks, tweaking
strikes and expiries to find the right risk vs. return. You could also quickly overlay equity index hedges such as put
options on the S&P 500 and see a side-by-side comparison of historical returns with and without the hedge. The
possibilities are unlimited.
Try it now.
Don’t have an account? Start your free trial today.
Tags: updates • options backtesting
26 Jul 2016
We put together the quick table below to help you navigate this week’s major earnings releases.
We show the post-earnings stock price moves that are implied by options on each company and
also highlight how often options markets were wrong in the past, where stock prices
immediately moved more than was implied after earnings.
Click the expected moves below to view the full analysis for each company.
|
Expected Move |
Options Wrong |
Last 6m Chg |
|
| Today |
| Apple |
4.1% |
30.0% |
-9.0% |
| Twitter |
10.5% |
61.5% |
+10.2% |
|
| Wed. |
| Facebook |
6.2% |
41.9% |
+8.3% |
| Coke |
2.6% |
50.0% |
-2.2% |
| Boeing |
3.3% |
60.7% |
+0.2% |
|
| Thurs. |
| Google |
4.7% |
47.4% |
-2.4% |
| Amazon |
7.2% |
32.8% |
+17.8% |
| MA |
3.3% |
18.6% |
-4.4% |
| Baidu |
7.0% |
24.3% |
-17.6% |
|
| Fri. |
| Exxon |
3.0% |
43.4% |
+6.9% |
| UPS |
2.7% |
56.8% |
+3.1% |
Tags: options market analysis • earnings
18 Jul 2016
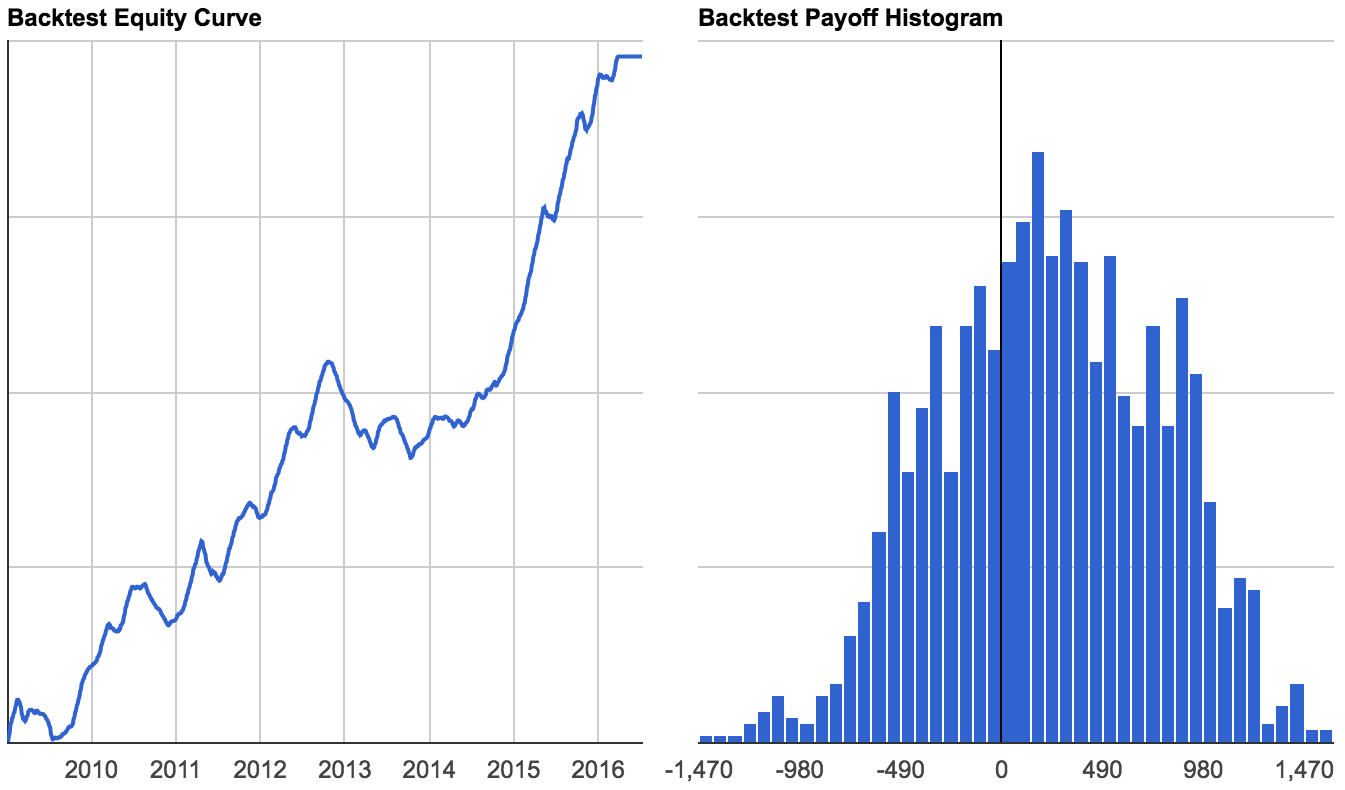
We’re announcing today the addition of equity curves and histograms to our options backtesting results to help you
better evaluate and uncover attractive trading strategies.
Our equity curves show cumulative profit/loss for your options backtest and make it even easier to understand your
strategy’s historical returns and drawdowns through time. In seconds, you can understand the net trend of your
options strategy and whether it would have been profitable historically.
Backtest histograms show the frequency distribution of outcomes to help you quickly discern the historical
probabilities of specific profit/loss events. This helps you easily visualize tail events and understand whether
your strategy’s historical returns are clustered around certain levels.
Together, these two new backtesting features will help you swiftly optimize and discover options strategies on Volatility.
Tags: options backtesting • equity curves • histograms • updates
14 Jun 2016
We’ve added the ability to backtest systematic strategies by option moneyness (strike price
relative to underlying price). This is particularly useful for evaluating options strategies
you trade at precise price levels, such as consistently
selling 5% out of the money strangles
Choose between option delta or moneyness in Calculation Type settings within Advanced
Parameters in the backtester.
This update gives you even greater flexibility over your options backtests.
Tags: options backtesting • updates