24 Nov 2015
You can now set your expected timeframe for your trade.
Volatility will incorporate your defined holding period into the backtest, giving you a perfect view into how
your trade would have performed in the past if held for your desired timeframe. This is really powerful,
and I’m really happy to finally bring it to you! Try it now.
While this feature is really easy to use, behind the scenes the calculation is extremely detailed. Volatility
will evolve the underlying’s price, implied volatility, dividends and interest rates according to your choices.
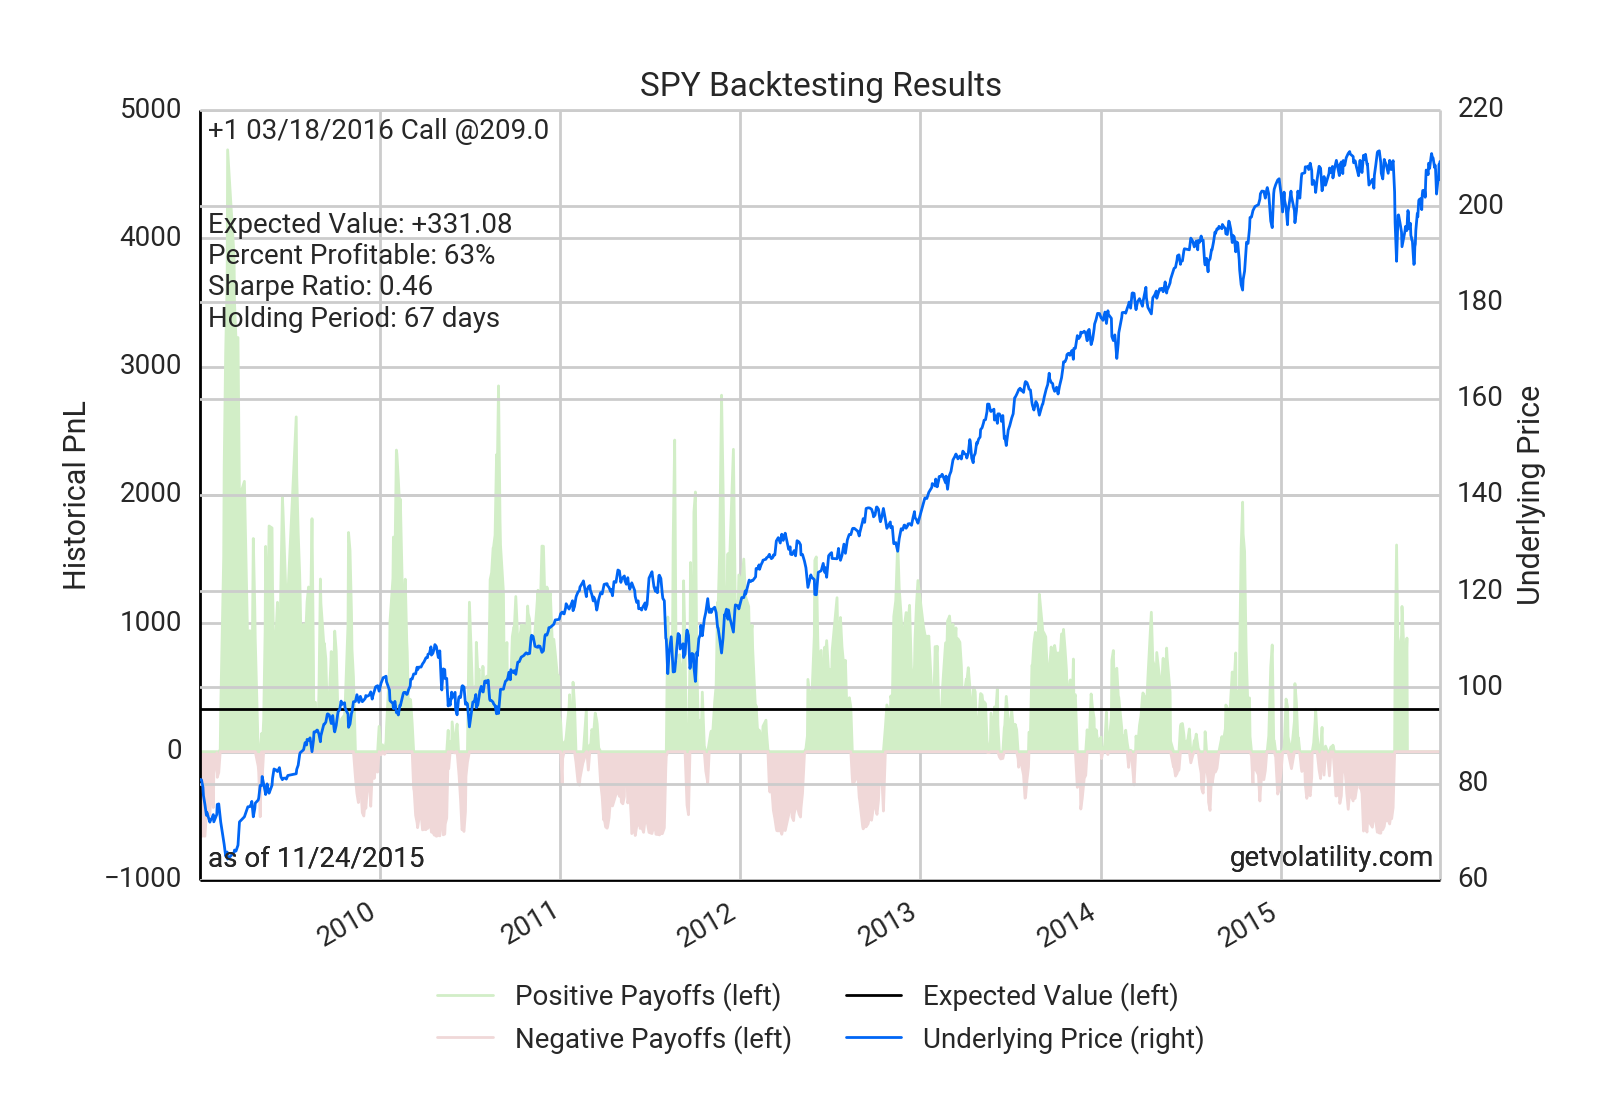
The example chart below shows a backtest of holding March S&P 500 calls until the end of January.
Volatility’s backtester
will give you an edge constructing your next trade idea.
Tags: updates • beta • options backtesting
07 Nov 2015
We released a simple but powerful feature that allows you to very easily evaluate the relative
cheapness or expensiveness of one option market against another. The Implied Volatility chart
on every Market Overview page now has a toggle for “ratio charting.” Selecting this option
will plot the ratio of one implied volatility against another.
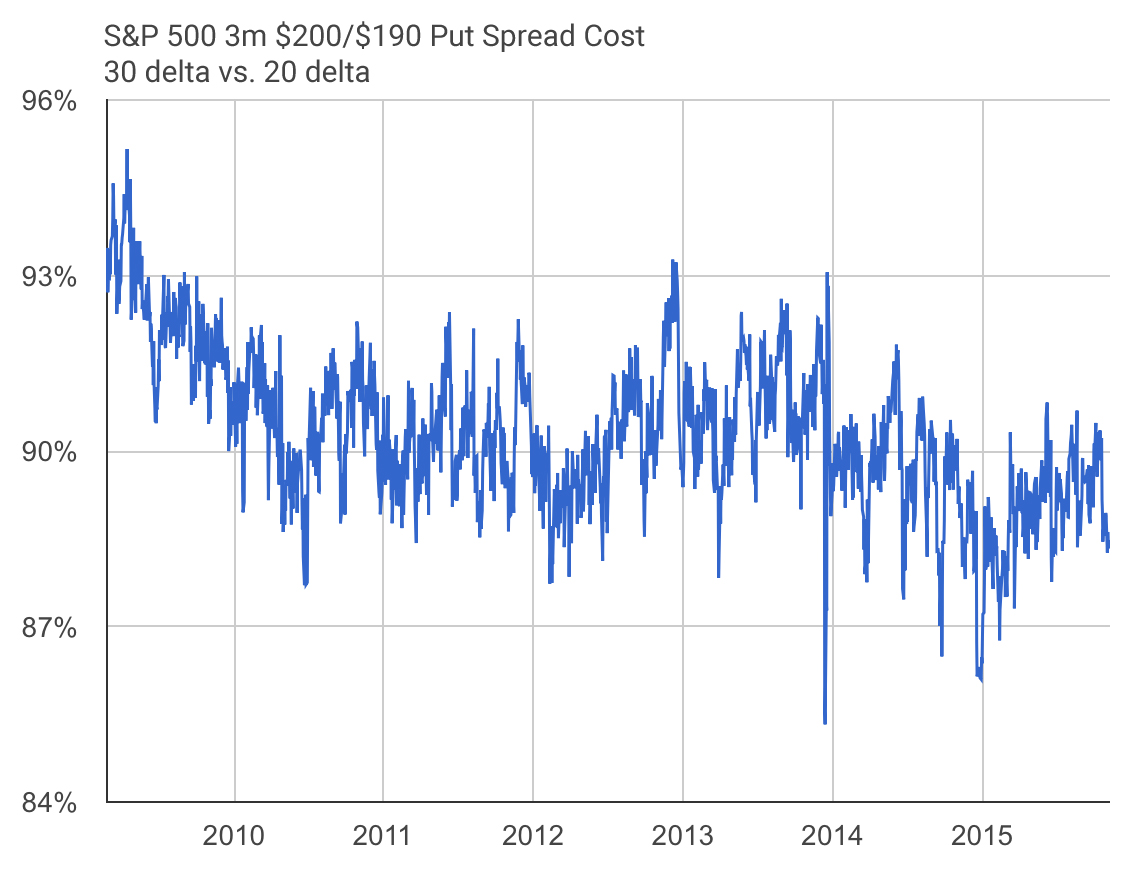
Two good use cases are put spreads and call spreads. For example, when buying a put spread,
one would generally want implied volatility on the bought put to be low relative to the sold put
as that means they’re collecting more premium for the trade. The chart below shows the ratio between those vols
for a three month $200/$190 put spread on the S&P 500 (SPY). The ratio is near its lowest point over the past seven years,
showing that the sold put (20 delta) is unusually expensive compared to the bought put (30 delta) and that
the put spread as a whole is historically cheap. This feature makes it easy to find cheap spreads to buy
and expensive spreads to sell.
This same analysis can be used for selling spreads and can be extended to multiple underliers. For example,
you could very easily chart the relative cheapness of S&P 500 options against Nasdaq options.
Try it out!
Tags: updates • beta • implied volatility • put spreads • call spreads
21 Oct 2015
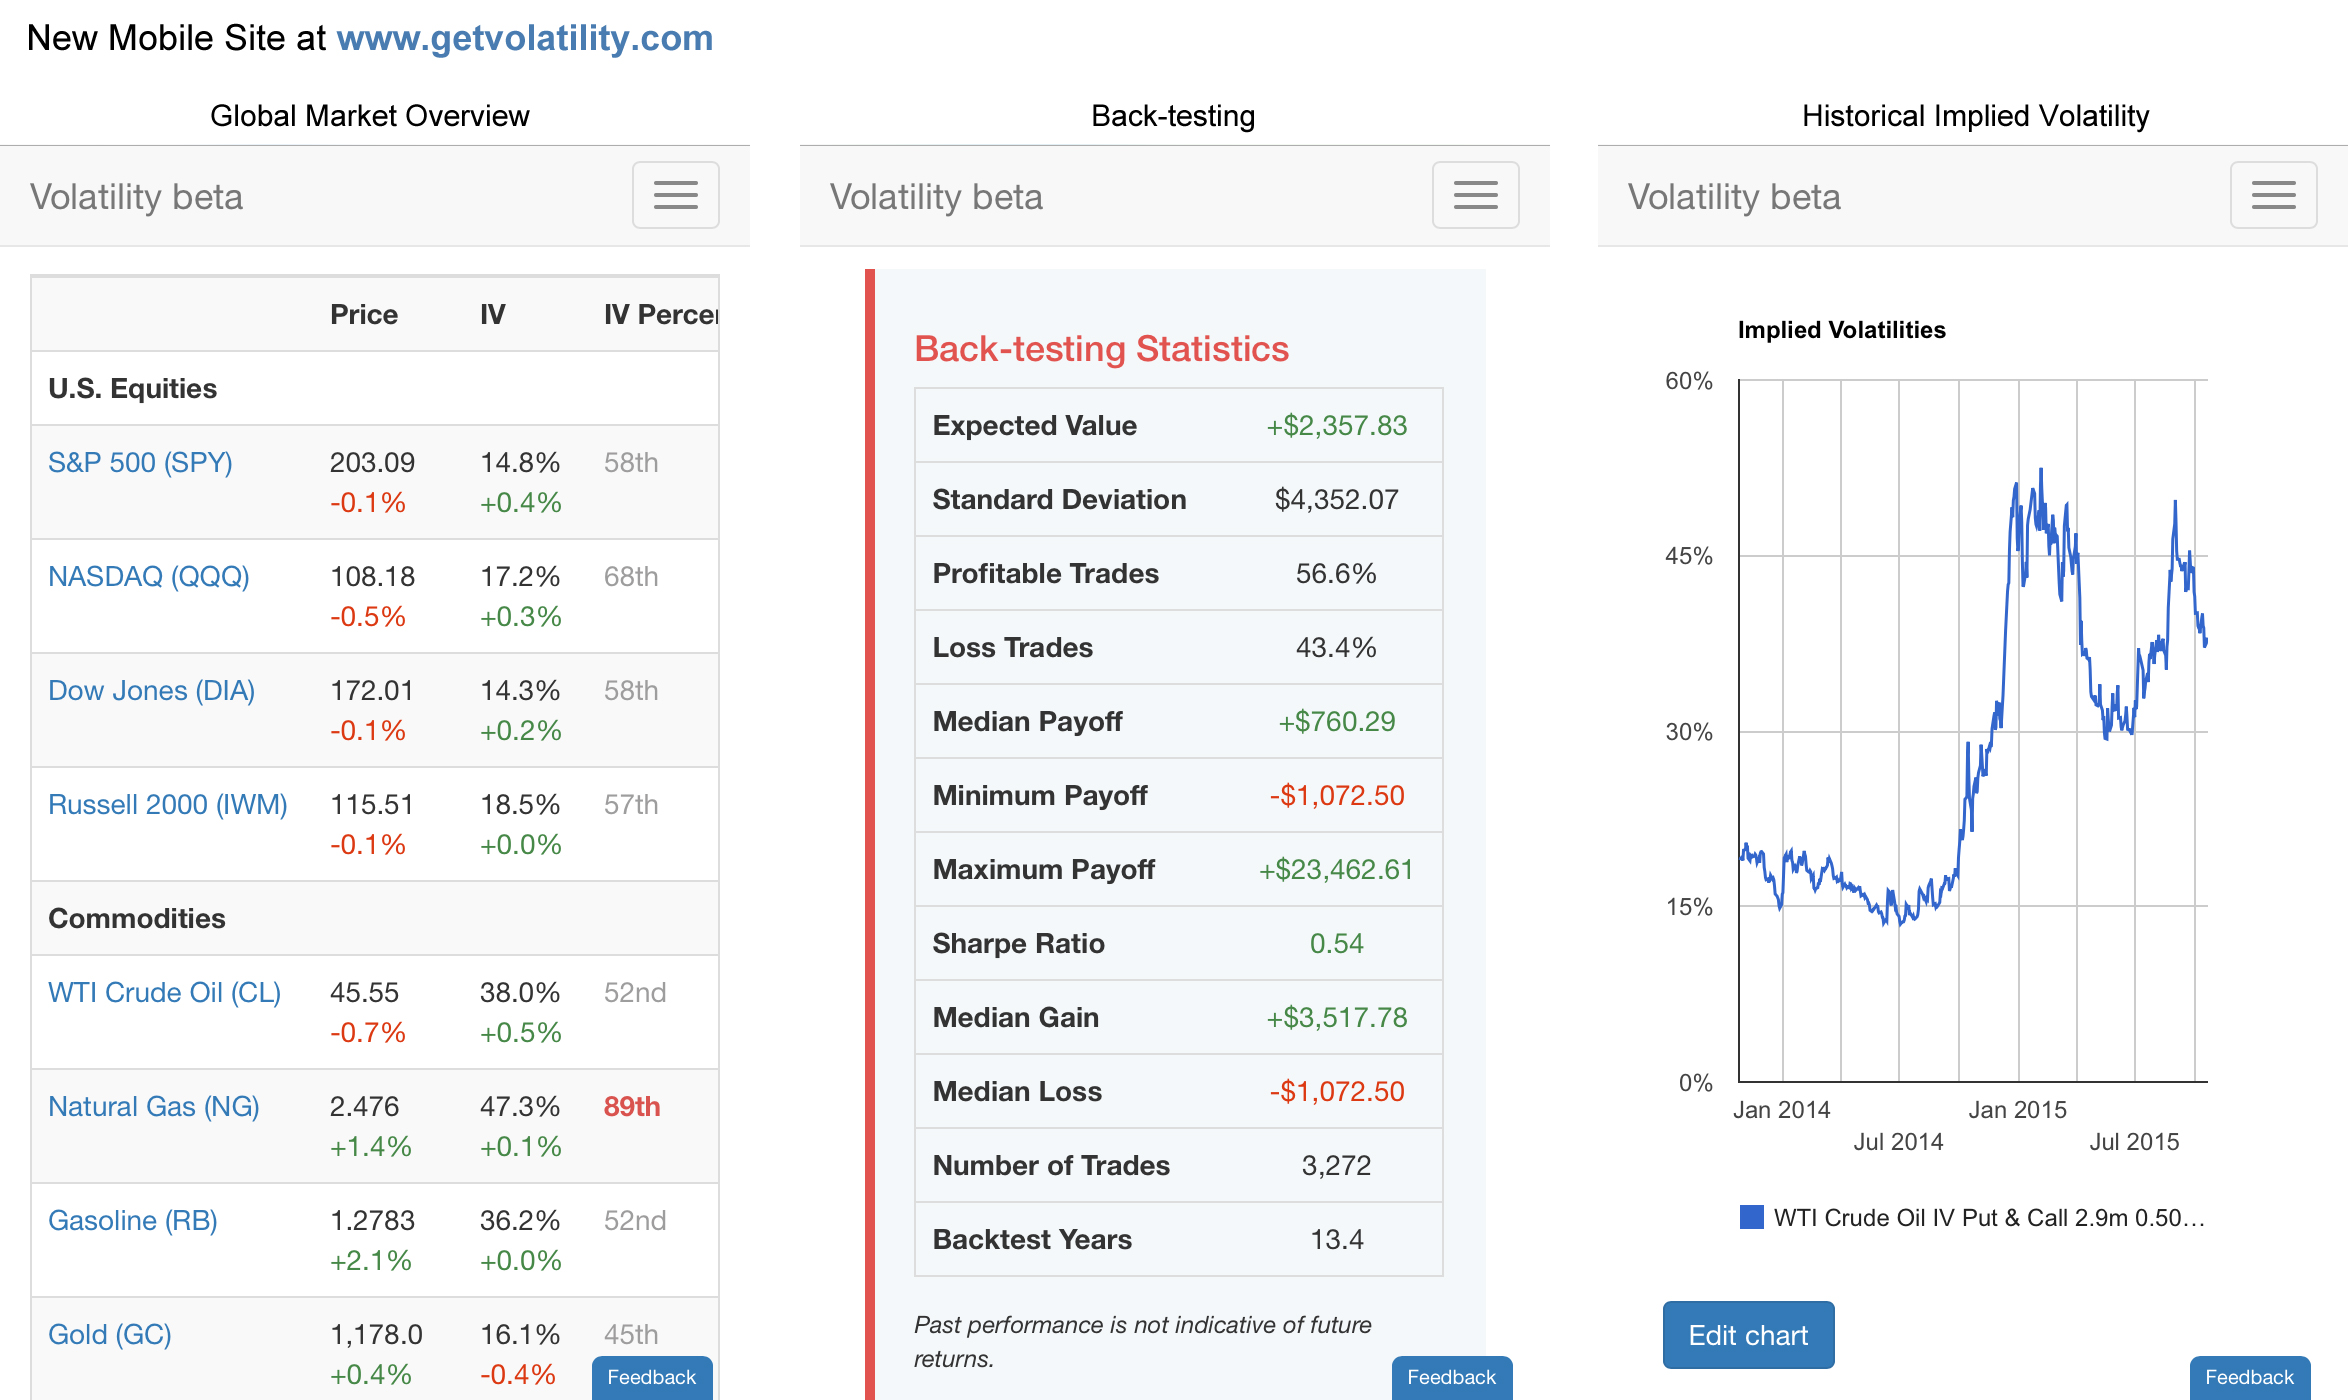
We released a bunch of updates this weekend including a new version of our mobile site! It’s
really easy to use and super fast. Now you can analyze option markets, view our statistical trading opportunities,
and backtest any strategy more easily on your phones and tablets. Visit Volatility
on your mobile device and let us know what you think.
Here are some screenshots from our mobile re-design:
Stress-testing updates
You can also now quickly see the impact of time decay in the the Scenario Analysis tool. As an example, you can use
the tool to see how a straddle bought before earnings would be priced after earnings under your expectations for the
underlying’s price and implied volatility by moving the pricing date forward.
Tags: updates • beta • mobile • stress testing
11 Oct 2015
The options market is expecting an unusually large move in Netflix (NFLX) stock after Q3 earnings are released this coming
Wednesday. Expectations priced into options haven’t been this high for an October earnings report
since four years ago in 2011 when the stock rose ~30% in the month after the release.
Reversal expected?
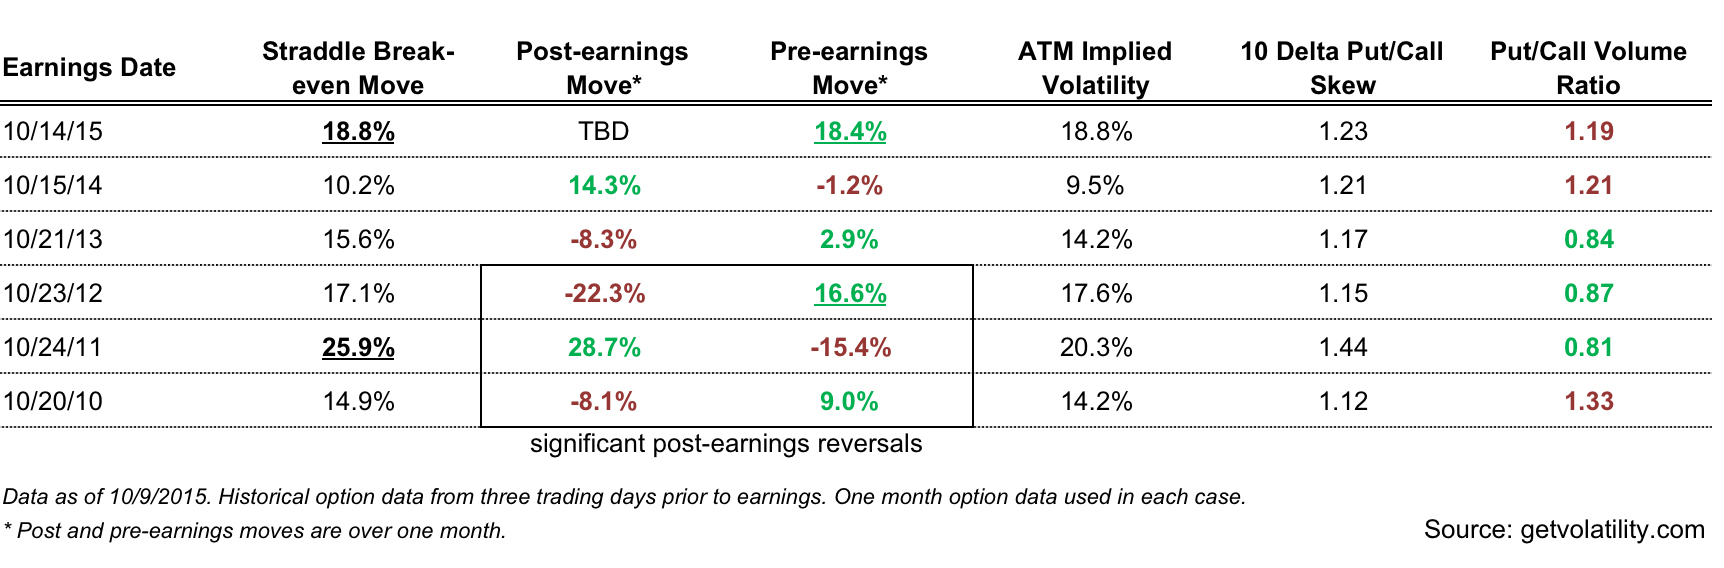
Netflix has risen 18.4% over the past month and has had >9% moves in advance of Q3 earnings in three of the five past years (2012, 2011, and 2010).
But in each of those three past occurrences, the post-earnings move has reversed the pre-earnings move (table below). Could traders
be positioning for history to repeat? Option volume has been bearish with 1.2x as many puts trading than calls for November 20 expiry.
Options anticipate an unusually big move
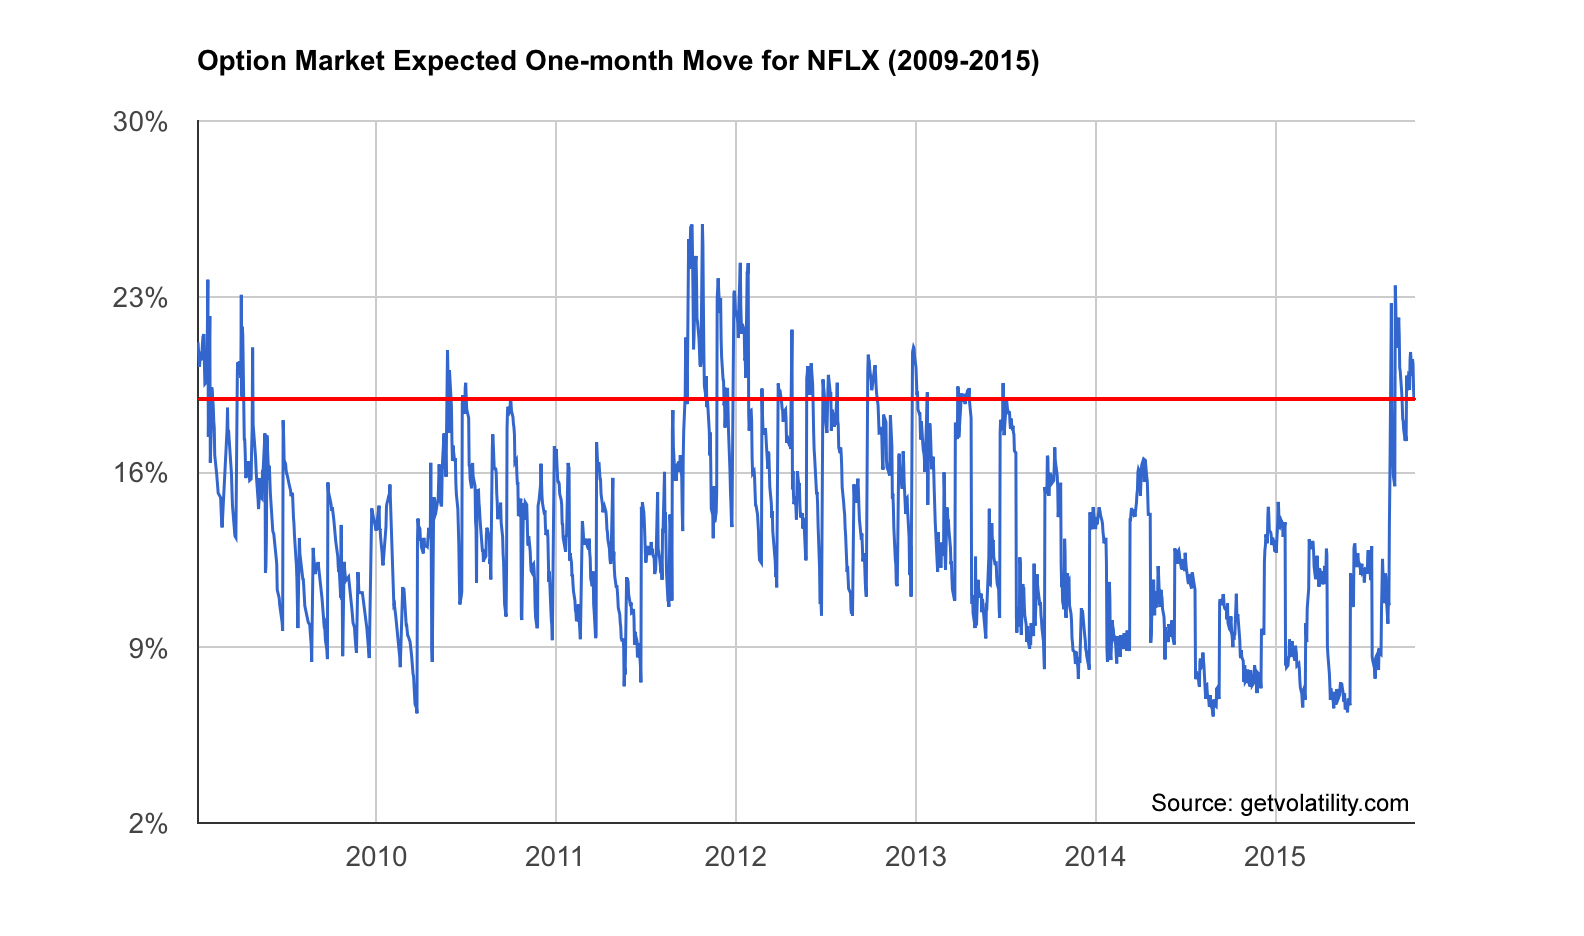
Option prices imply a very wide range of $92.02 to $134.64 for NFLX over the next month. Straddle breakevens (the amount
NFLX needs to move for option volatility sellers to start losing money) are at 18.8%,
the highest level for October earnings since 2011 when it was 25.9%.
The chart below from Volatility shows the market expectation for a one-month move in NFLX going back to 2009. The market’s current expectation
of 18.8% is in the 90th percentile going back to 2009 and is almost the maximum occurrence since early 2013. While selling straddles
at this pricing would have been historically profitable 64% of the time over the entire six year range, it would only have been
successful for three out of the five past Q3 earnings releases.
Option pricing points to a big week for Netflix. Share what you think will happen in the comments below!
Data source: Volatility, @getvolatility
Tags: NFLX • earnings • options market analysis
06 Oct 2015
We released a few features and improvements this weekend.
- The backtesting date range is now user-modifiable. The backtester will continue to use the full range of historical data that is available by default.
- The Screen tables have been updated to be significantly more user-friendly. The tables can now be sorted by multiple factors and are searchable.
- Statistical opportunities expiration date change bug fix.
- Speed and stability improvements.
- Improvements to the password reset process.
Stay tuned for more!
Tags: updates • beta • options backtesting • options screens