Volatility Dashboard
The Volatility Dashboard is designed to give you an overview of where global options markets are currently trading and to help you quickly find trades that interest you.
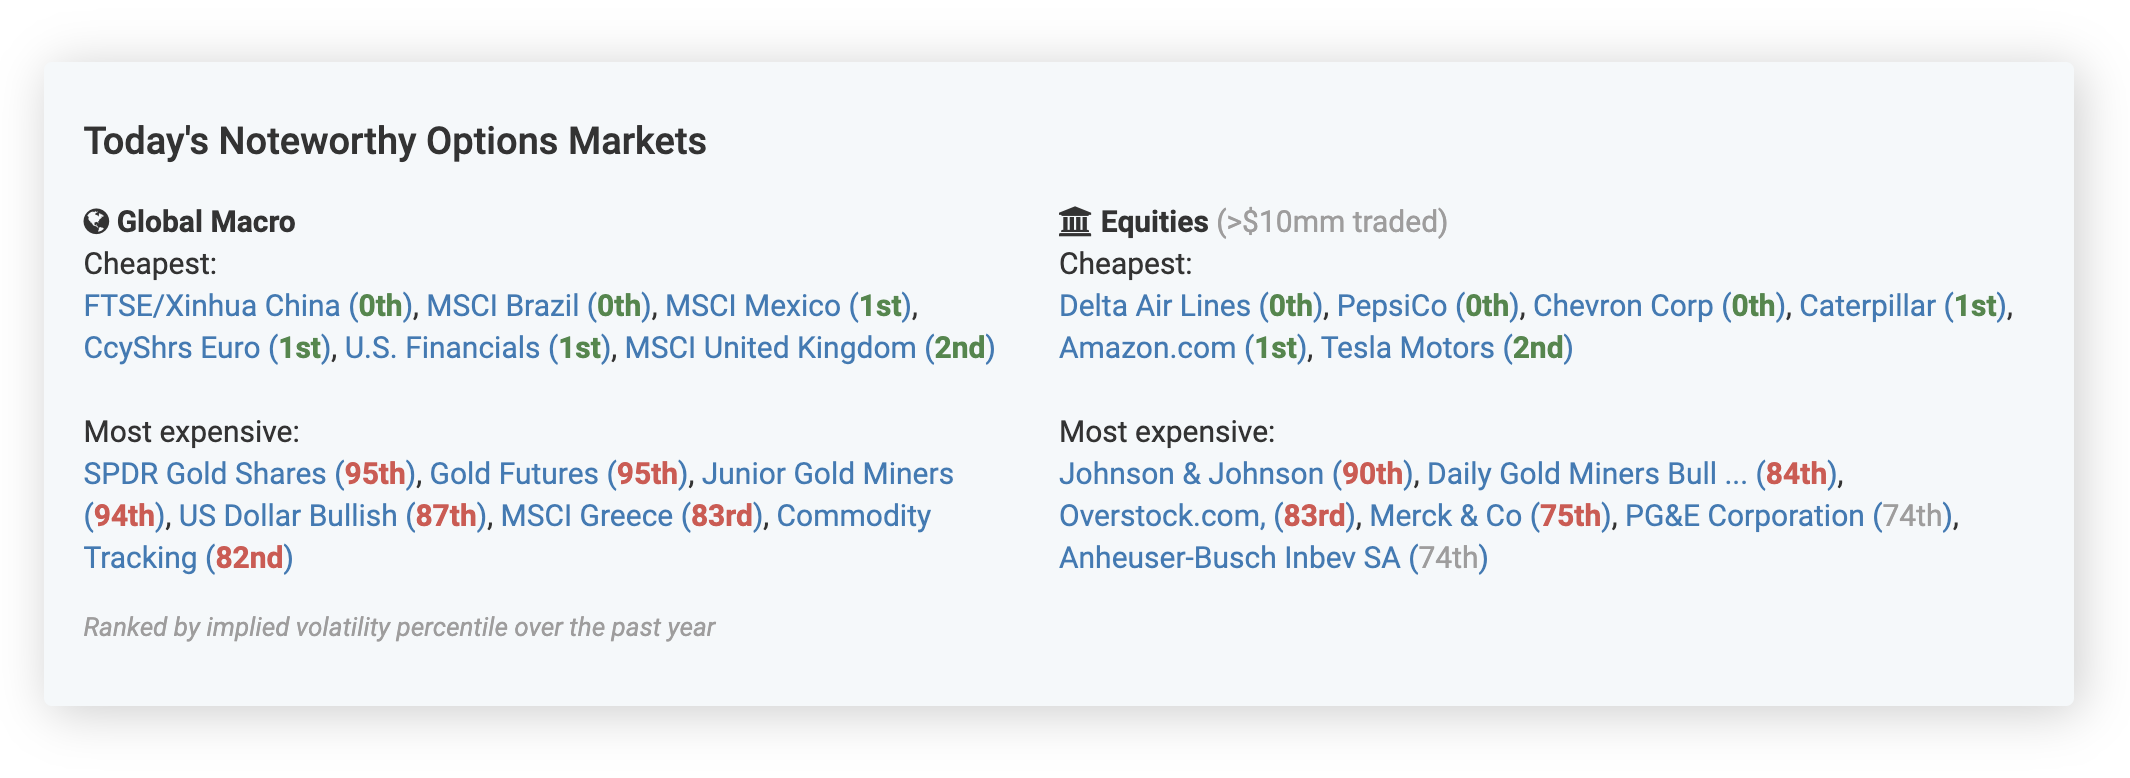
Today's Noteworthy Options Markets
This section highlights which options markets are currently trading most cheaply or most expensively compared to their history. In just a few seconds, this tool helps you identify where it’s currently the cheapest to purchase options and the most expensive to sell options, helping you "buy low and sell high". This tool is split between Global Macro markets, which include major global ETFs, currencies, commodities, and fixed income products, and Equities, which include U.S. traded stocks with more than $10mm in notional options trading volume. Percentiles are calculated over the last year.
All of the data within Volatility’s Options Screening tools can be toggled to reflect different implied volatility and option expirations. By default, the tools will show implied volatilities and percentiles based off options that expire in three months. You can use the dropdown in the top right of the page to change this to "1w" or 1 week, "1m" or 1 month, "6m" or six months, "1y" or 1 year, and "2y" or 2 years option expiries.
Major Markets and Charting
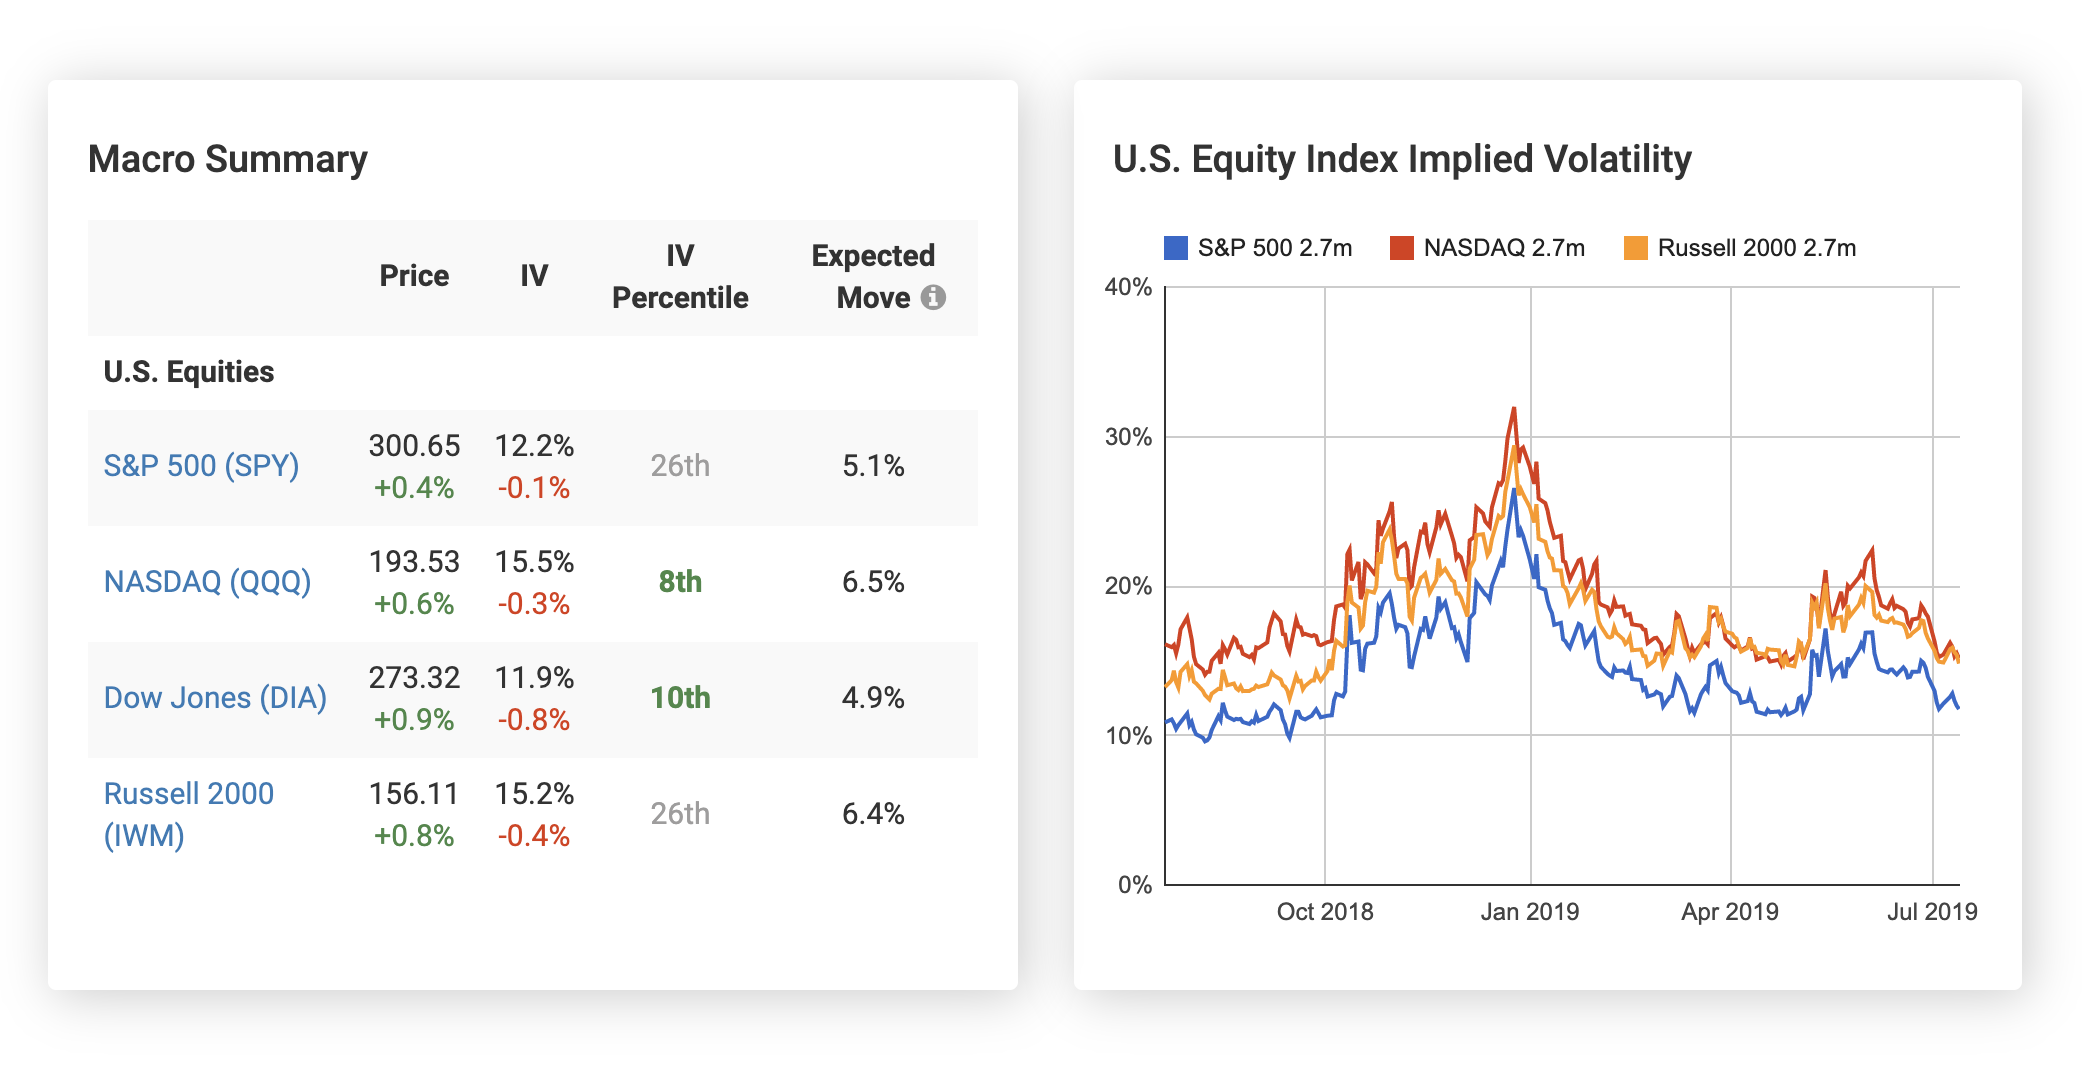
Underneath Today’s Noteworthy Options Markets are pricing summaries for major U.S. equity indices, commodities, international markets, and U.S. sectors. You can quickly see each of these market’s current price and implied volatility and their change day-over-day, in addition to their implied volatility percentile over the past year. On the right of this section are historical charts of each of these implied volatilities, so you can quickly visualize the context around their current levels.