Technical Indicators
You can customize several technical indicator entry and exit conditions for your options strategy backtest. Supported technical indicators include simple moving average (SMA), exponential moving average (EMA), relative strength index (RSI), moving average convergence divergence (MACD), and stochastic oscillator. For example, with these customizations you can quickly analyze the historical profitability of purchasing call options when the 50-day moving average crosses above the 200-day moving average or when the relative strength index is above 50. These inputs are very flexible, and you can backtest multiple technical indicator conditions together.
Moving Averages
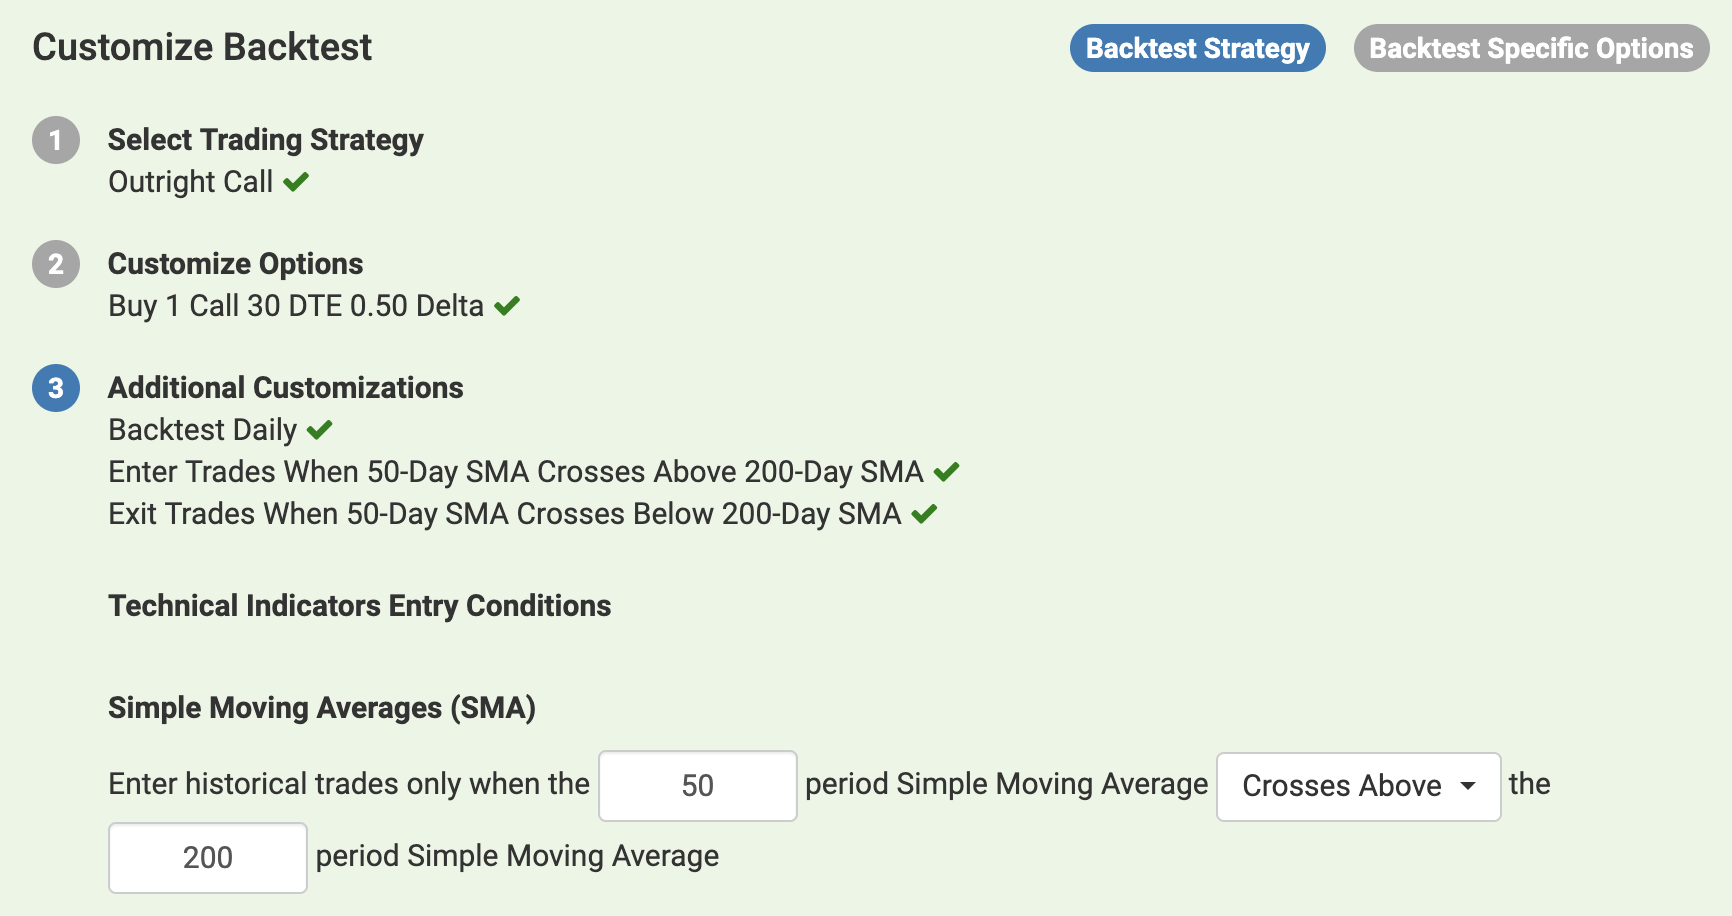
You can enter or exit trades based off simple moving average and exponential moving average conditions. In the first input box as per the screenshot below, enter the period of moving average you want to utilize for your condition. For example, enter "50" for the 50-day moving average. In the dropdown menu, you can select whether your entry or exit condition is based off one moving average crossing above another ("Crosses Above"), one moving average crossing below another ("Crosses Below"), one moving average being larger than another ("Is Above"), or one moving average being smaller than another ("Is Below").
Simple Moving Averages and Exponential Moving Averages are supported.
Relative Strength Index
You can enter or exit trades when the standard 14-period Relative Strength Index is above or below a certain value.

Moving Average Convergence Divergence
You can backtest entering or exiting your options strategy when the moving average convergence divergence indicator's MACD line crosses above, crosses below, is above, or is below the indicator's signal line.

Stochastic Oscillator
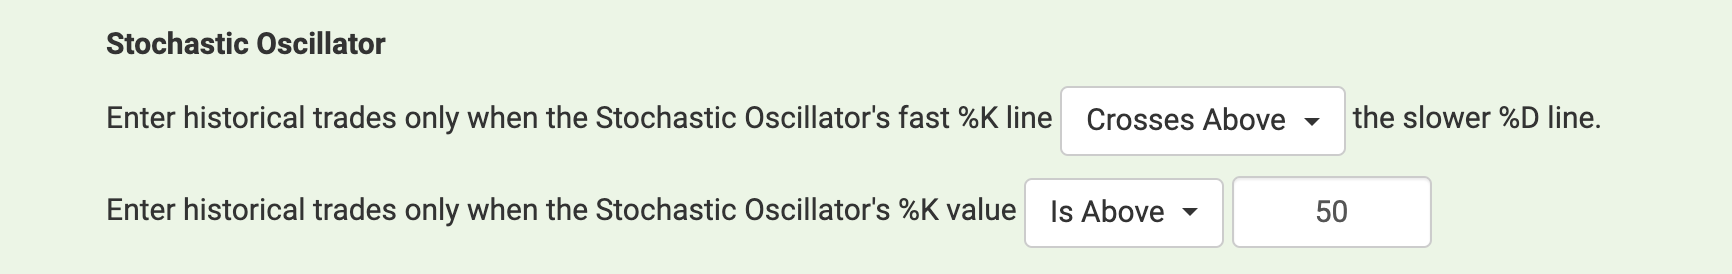
You can backtest only entering historical trades when the Stochastic Oscillator's fast %K line crosses above, crosses below, is above, or is below the slower %D line.
You can also choose to only enter trades when the %K value is above or below a certain value.
Indicator Input Details
- Crosses Above: Only includes the specific trade dates where the first indicator crosses above the second indicator.
- Crosses Below: Only includes the specific trade dates where the first indicator crosses below the second indicator.
- Is Above: Includes all trade dates where the first indicator's value is above the second indicator's value.
- Is Below: Includes all trade dates where the first indicator's value is below the second indicator's value.