Scenario Risk Analysis
Volatility provides flexible stress testing functionality so that you can truly understand how your strategy could perform under different market environments.
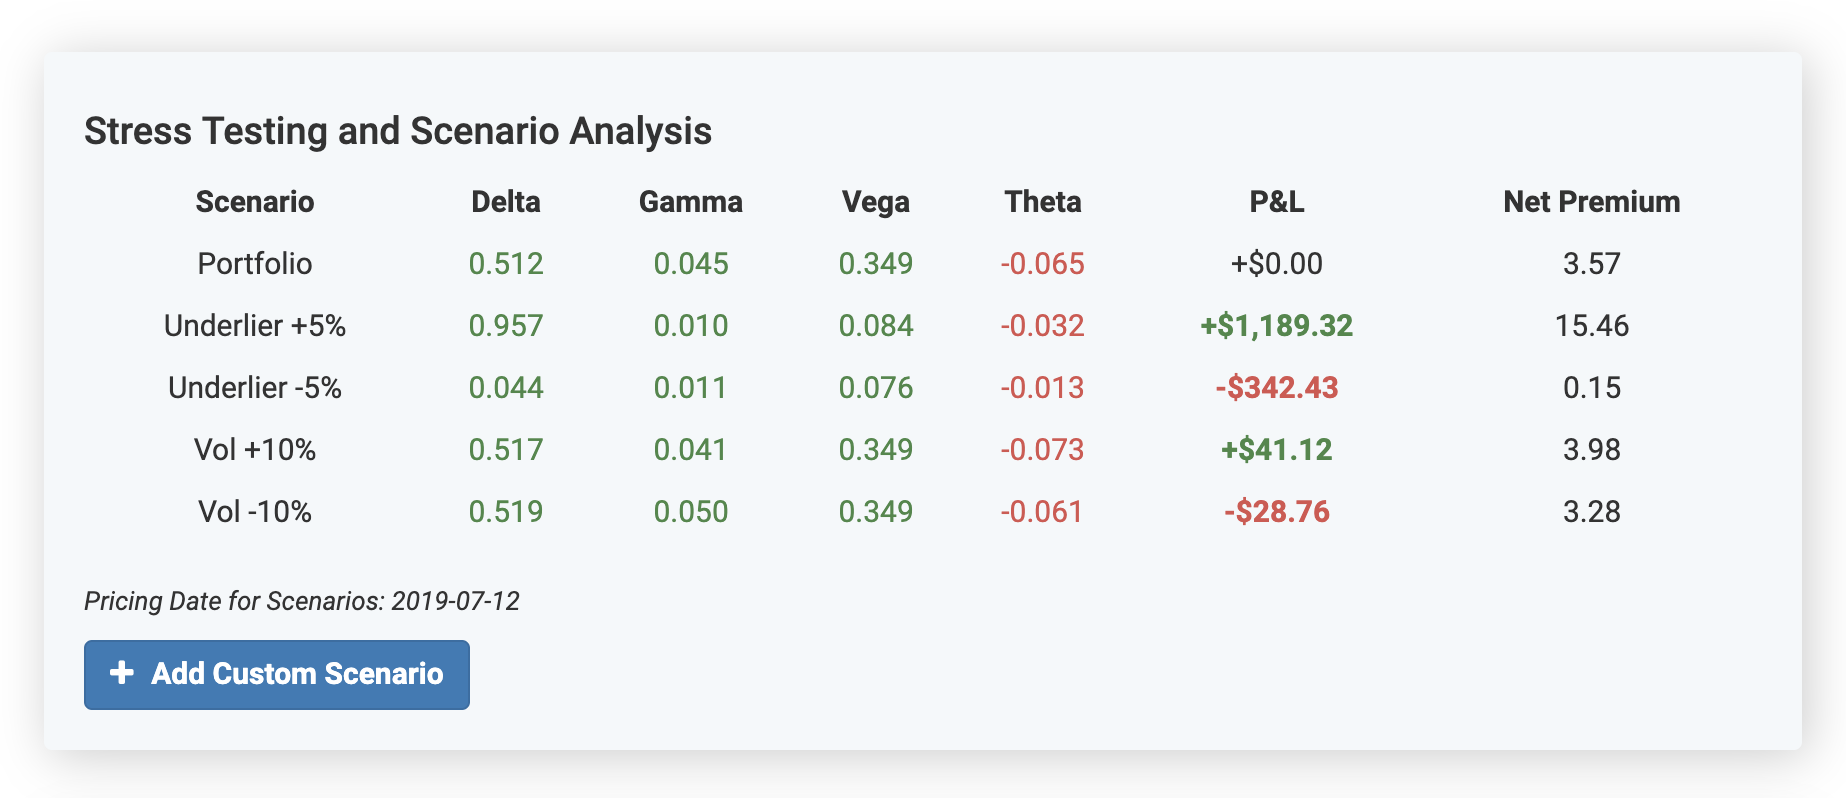
Stress Testing
Every options backtest includes stress testing results which show how your strategy would react if the underlier were to move up or down 5% and if its implied volatility were to move up or down 10%. The implied volatility shocks are relative, so if the underlier has a current implied volatility of 20%, the 10% up shock would incorporate a 22% implied volatility. This tool displays your P&L, net premium and option greeks including delta, gamma, vega, and theta under each scenario.
You can also see how your strategy would react to any custom underlying price and implied volatility at any future date using the “Add Custom Scenario” button.
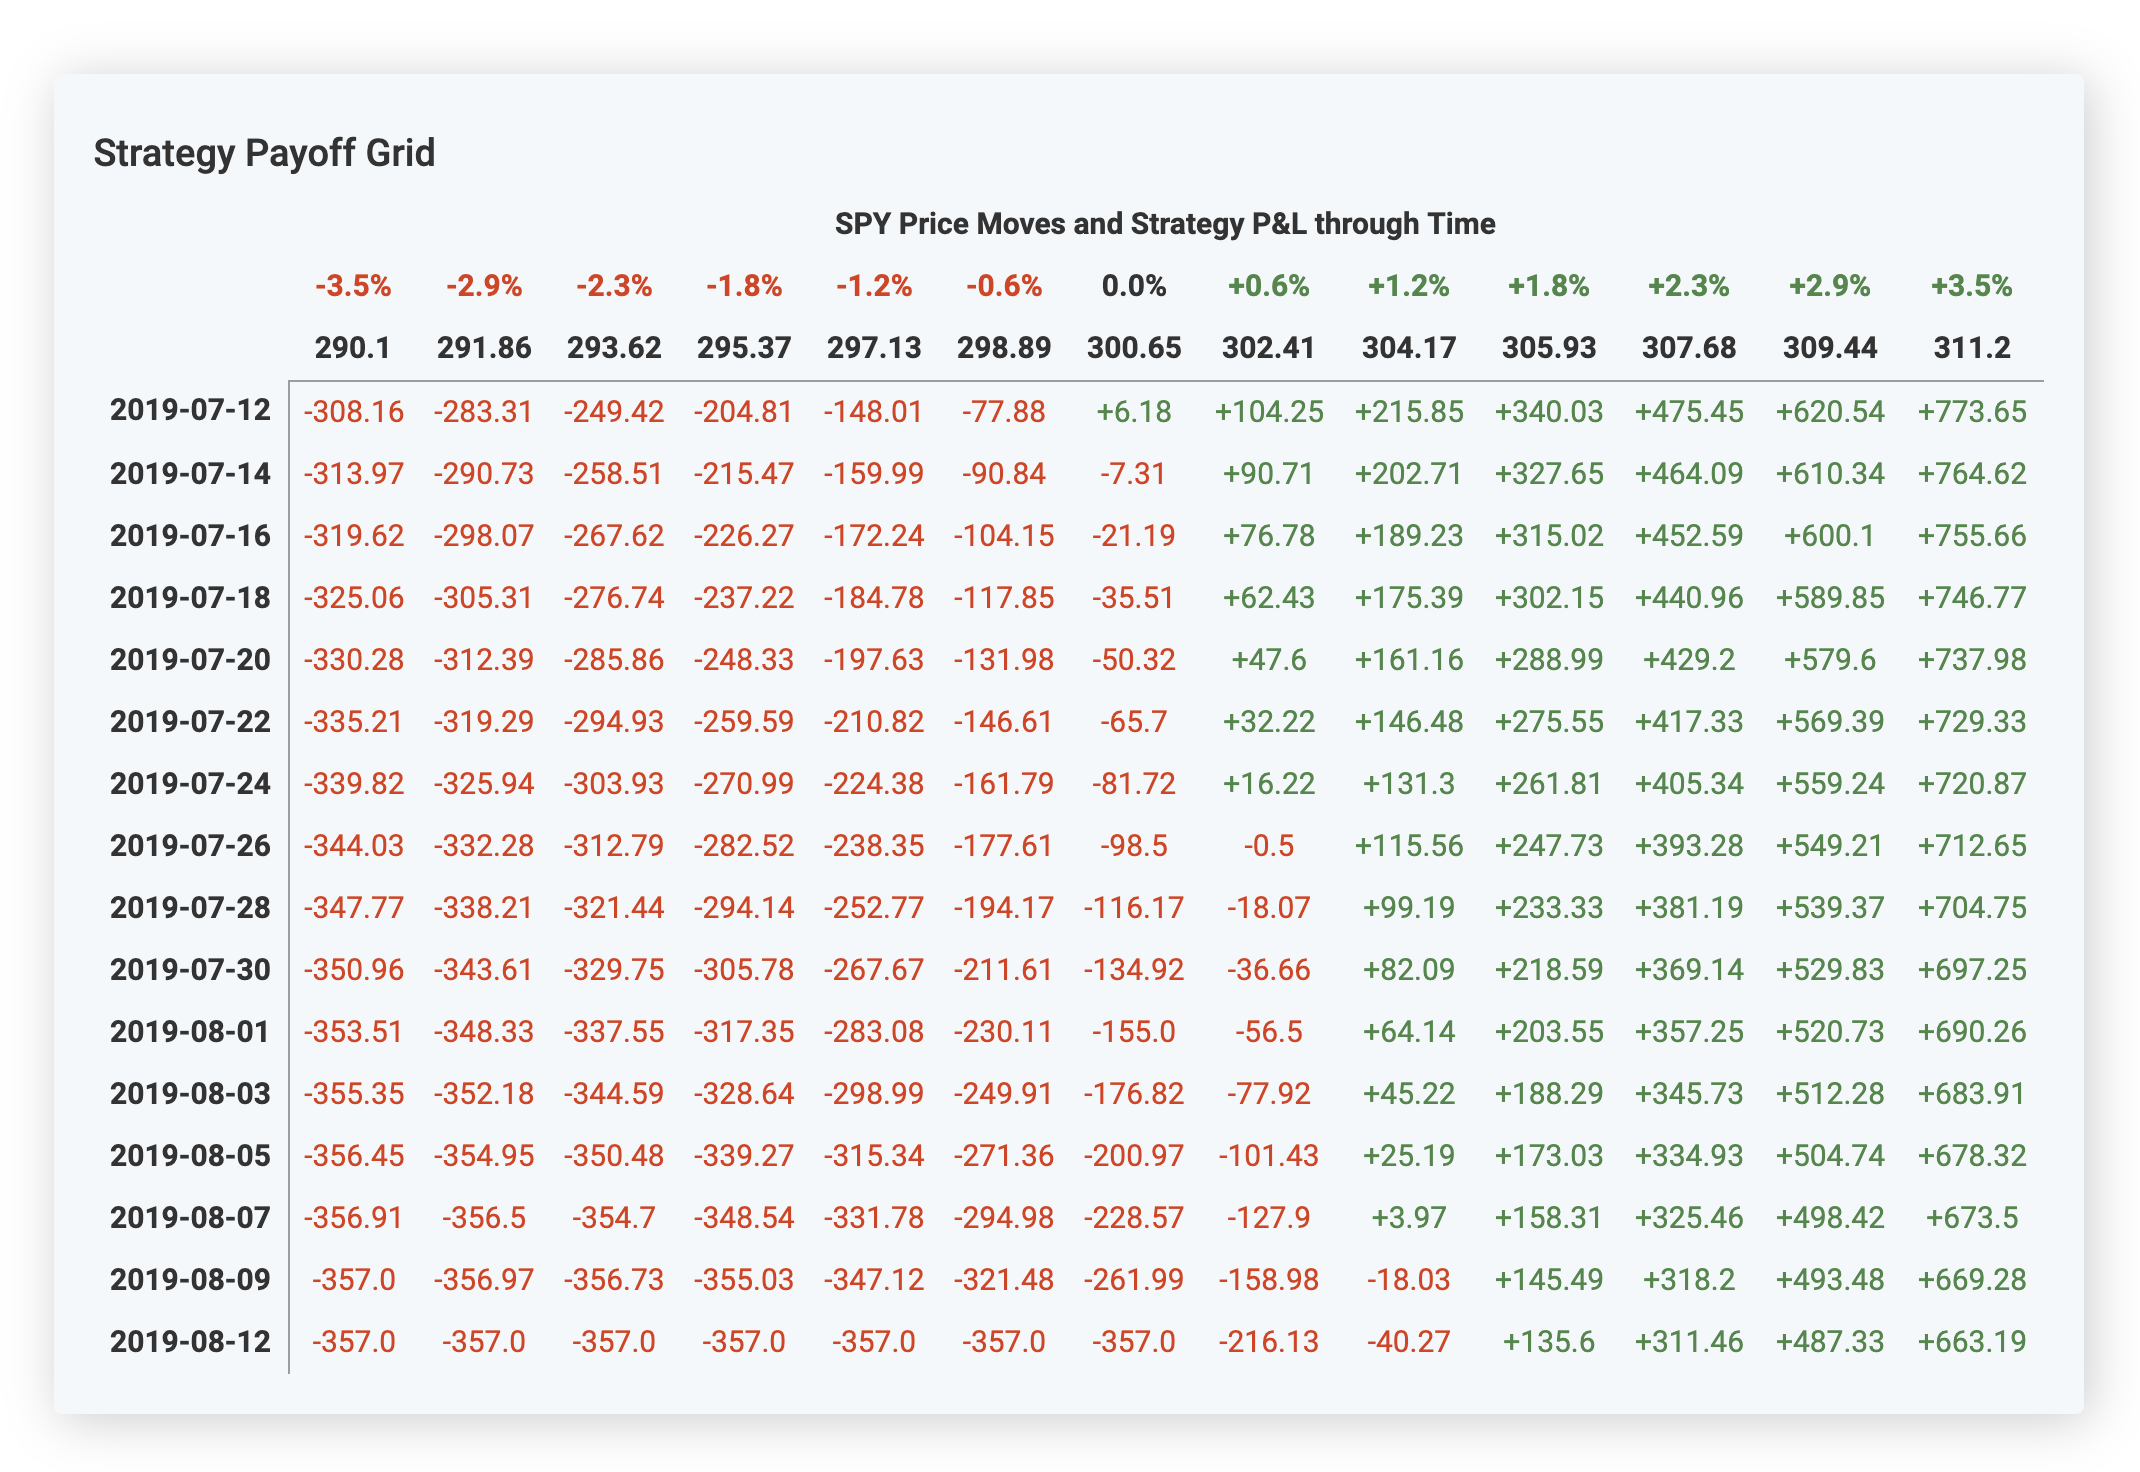
Strategy Payoff Grids
This grid shows you strategy P&L under different underlying price moves into the future until your strategy’s expiration. The top axis includes varying underlying prices up and down from the current level. The left axis includes dates until expiration. The grid helps you visualize exactly under which scenarios you would make or lose money. It’s also particularly helpful for helping you visualize your time decay for bought options strategies.