Put/Call Volume Charting
Put/Call Ratio Charts
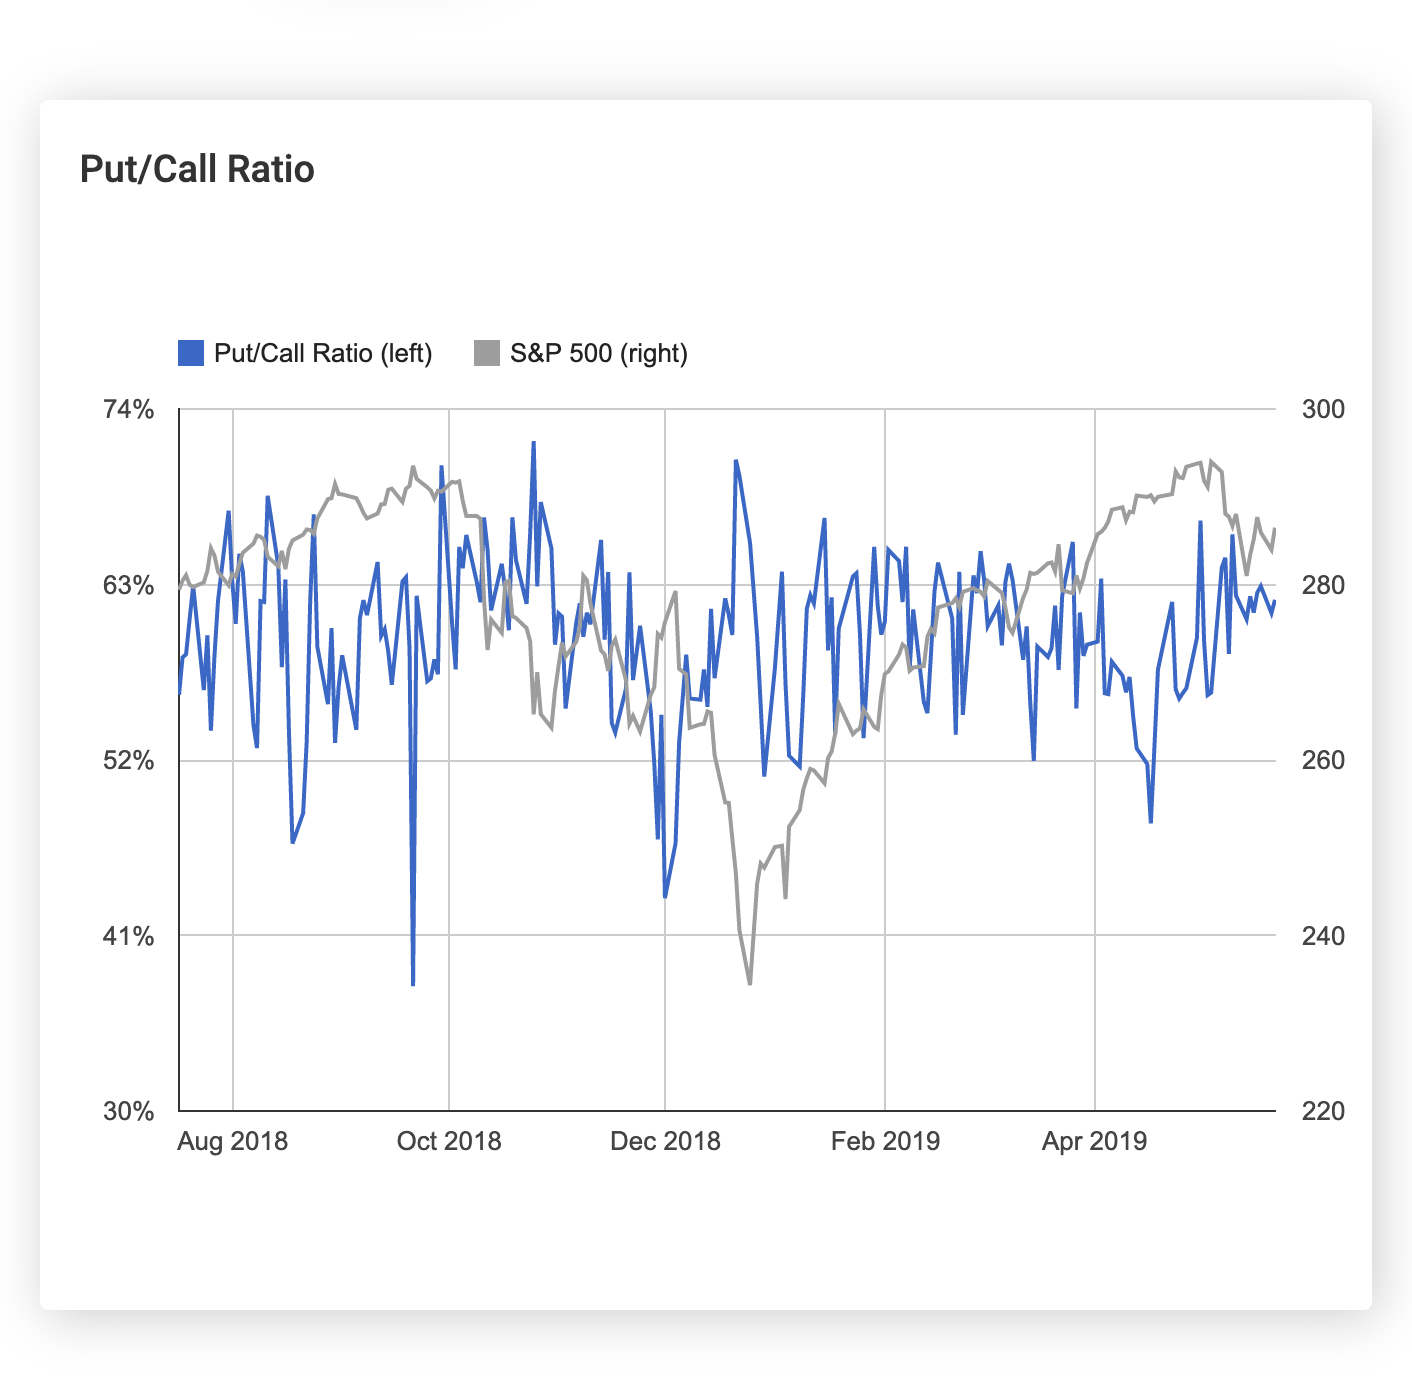
Put/Call Ratio charts shows the volume of a security's put volume relative to its call volume over time. Traders use these charts to identify times of peak pessimism (when there are predominantly put buyers and scarce call buyers) and times of extreme exuberance (when there are predominantly call buyers and scare put buyers). These charts are often used as contrarian indicators that could signal overbought or oversold levels.
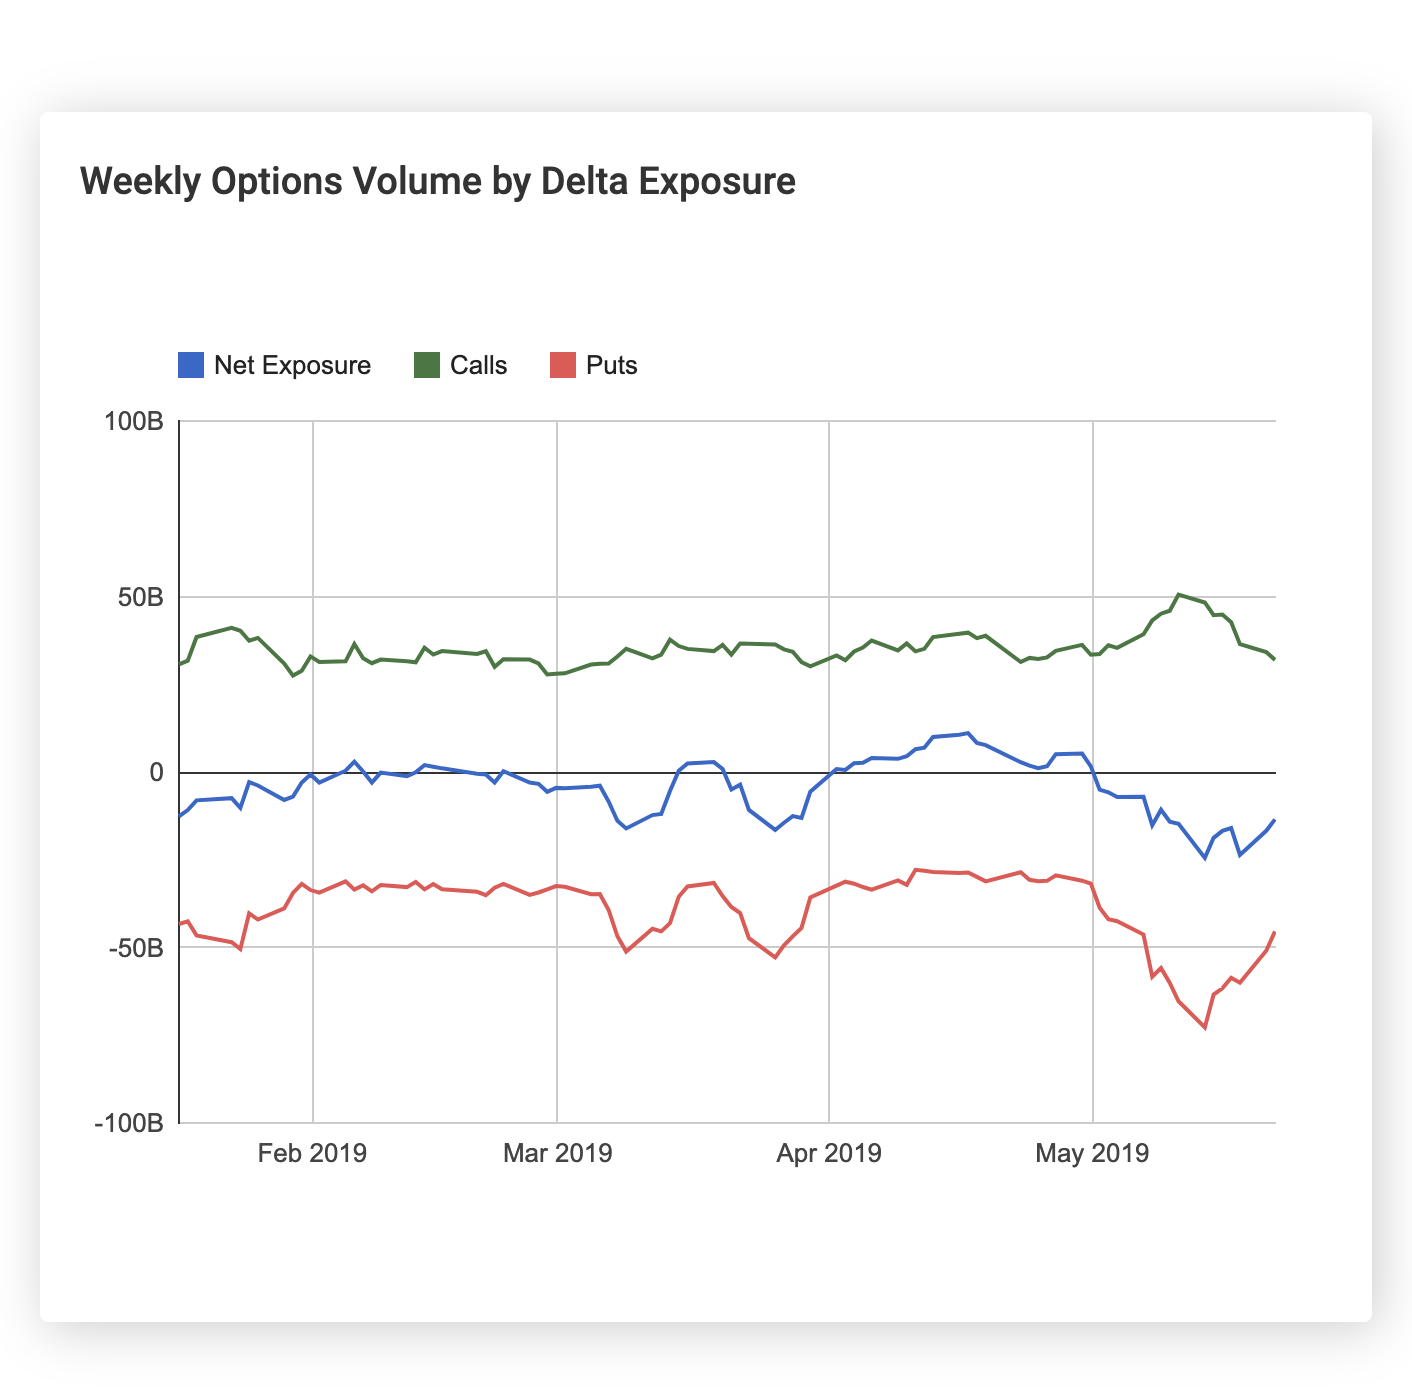
Weekly Options Volume by Delta Exposure
While the Put/Call Ratio chart looks purely at volume metrics, the Weekly Options Volume by Delta Exposure chart aims to incorporate the risk of an options position in addition to the volume. This chart shows the delta-adjusted notional value of puts and calls traded each week in addition to the net delta-adjusted notional across all options. Delta-adjusted notional is calculated as the delta of the option times the underlying's price times the volume of contracts times the number of shares represented by a single options contract.
For example, a trade of 100 contracts of 0.20 delta calls on a stock trading at $100 would represent $200,000 in delta-adjusted notional (100 contracts * 0.20 delta * $100 stock price * 100 shares per contract).