Market Positioning Charting
Our Market Positioning charts show you the net position of other traders on a delta, gamma, theta, and vega basis. This information is crucial for determining what other traders are doing and can be used to your advantage. Large positions can have a momentum to them as dealers on the other side need to continually re-hedge the risk as markets move. For example, if investors build a sizable short put position, dealers that are long the puts will need to buy more and more stock to delta hedge if markets decline. As a result, this kind of market dynamic can create a volatility dampening effect in the short-run and is important information for an options trader to have and incorporate into their strategies.
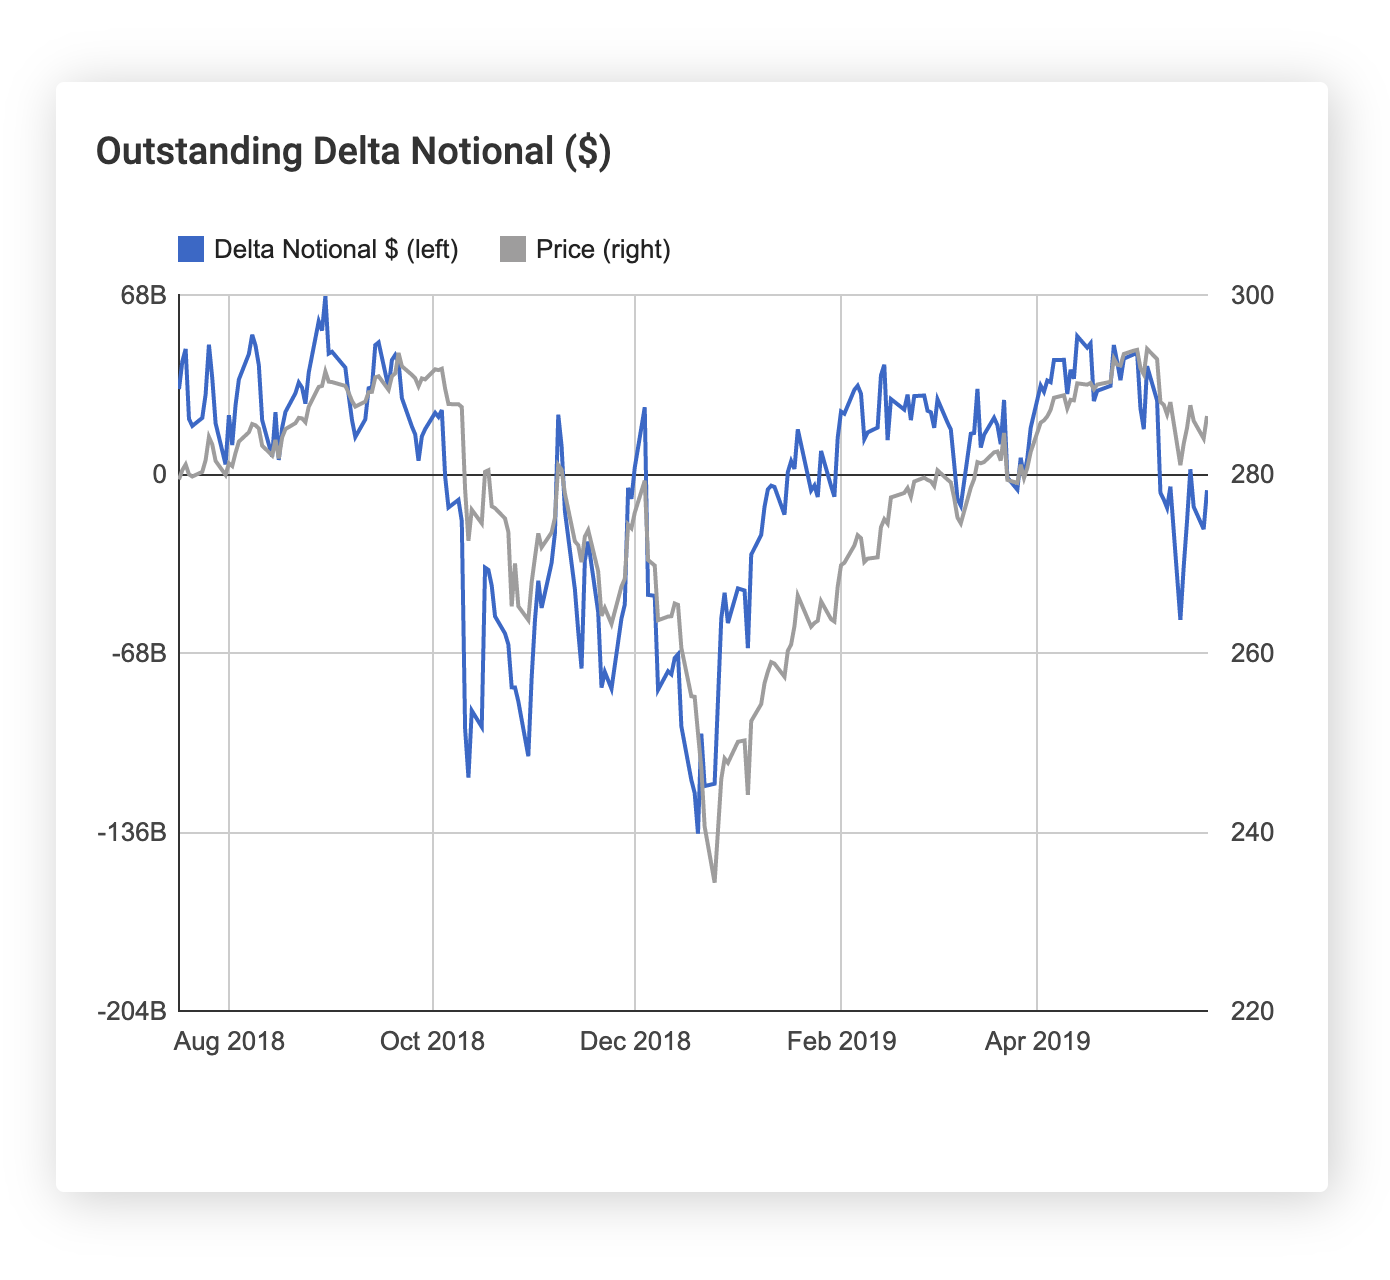
Outstanding Delta Notional
This chart shows the net delta position of options traders on a particular underlier. Delta-adjusted notional is calculated as the delta of the option times the underlying's price times the open interest of contracts times the number of shares represented by a single options contract.
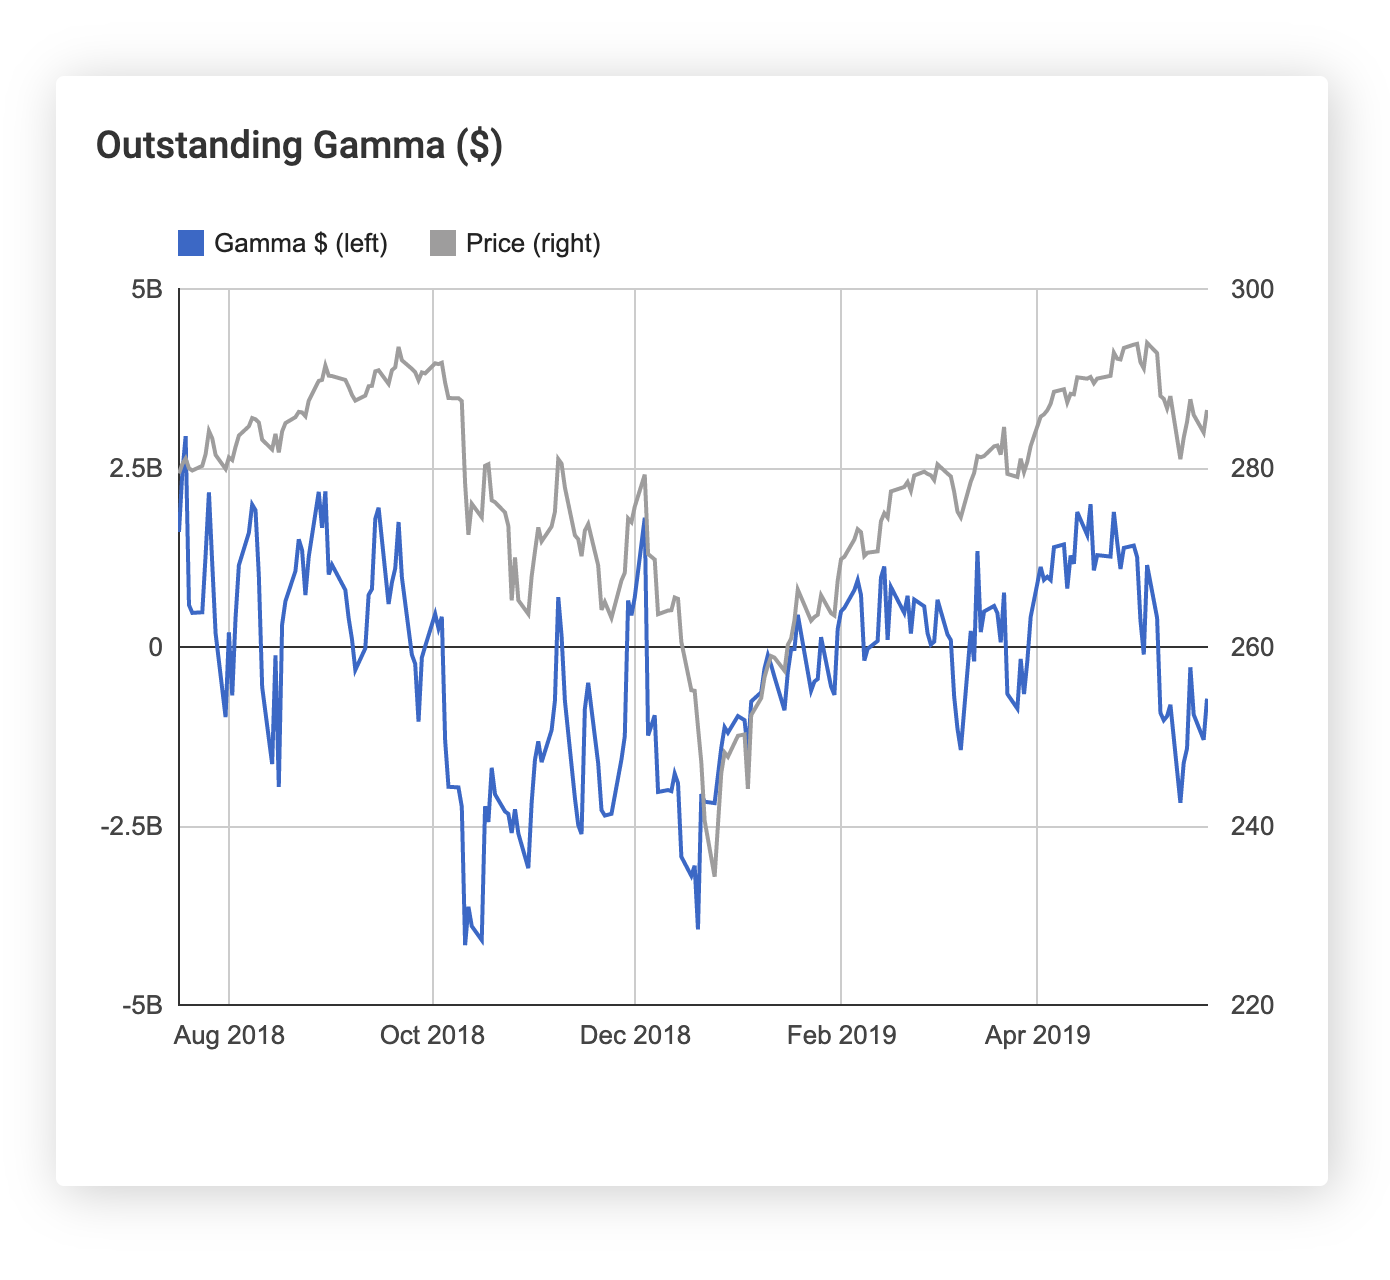
Outstanding Gamma
This chart shows how the net delta position of options traders will change for a $1 movement in the underlying's price. For example, a large positive gamma would indicate that dealers on the other side of those positions will need to sell a large amount of shares as the stock price rises and buy them back as the stock price falls. This volatility dampening effect can have a big impact on how the stock moves if the gamma position is extremely large relative to historical levels.
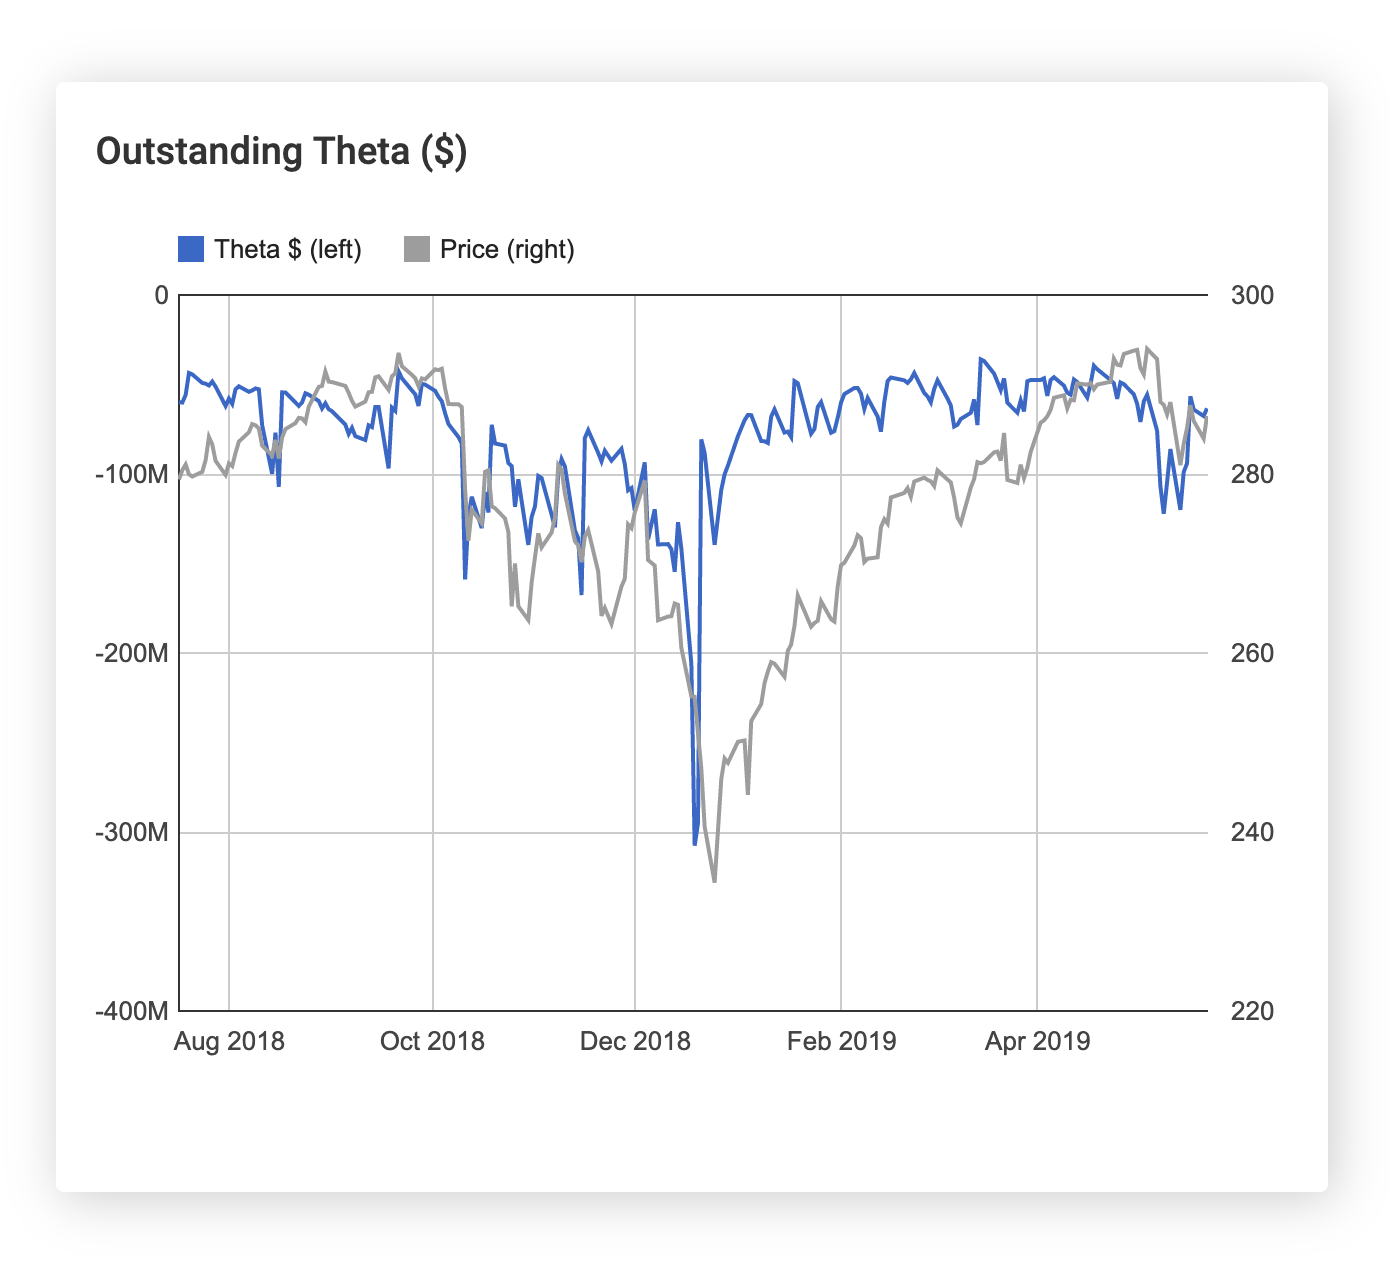
Outstanding Theta
This chart shows the total premium that options buyers are paying on a daily basis to hold their positions. Unusually large spikes in this value can indicate a rush to purchase protection and can signal oversold levels. For example, in the chart below for the S&P 500 ETF (SPY), outstanding theta spiked significantly just before the market reached a local bottom.
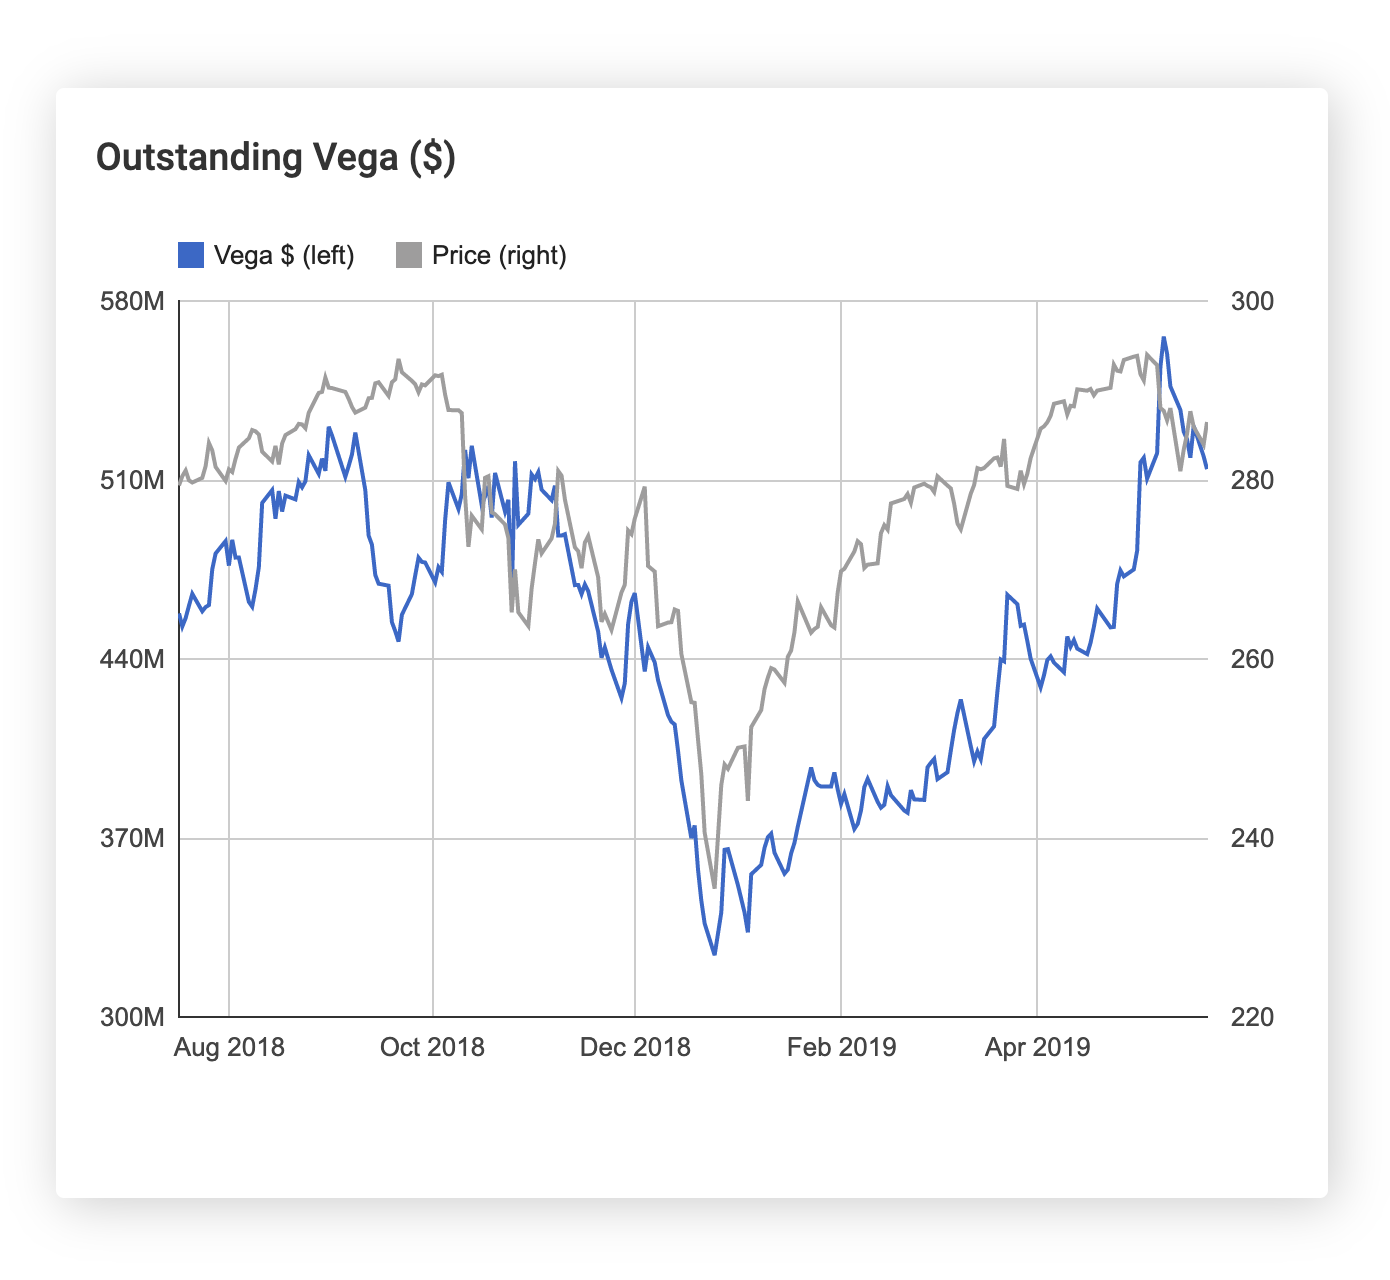
Outstanding Vega
This chart shows the net vega position of options traders which represents the P&L they will realize if the implied volatility of the underlier moves up 1%.