Macro and Equities Screens
Volatility’s Macro and Equity Screens allow you to cut through a large amount of market data in order to find the right trading opportunities for you. The Macro Screen includes key options data for global macro markets spanning equity indices and major ETFs, fixed income, currencies, and commodities markets. The Equities Screen includes options data for several hundred equities encompassing over 99.9% of all options trading volume in the U.S.
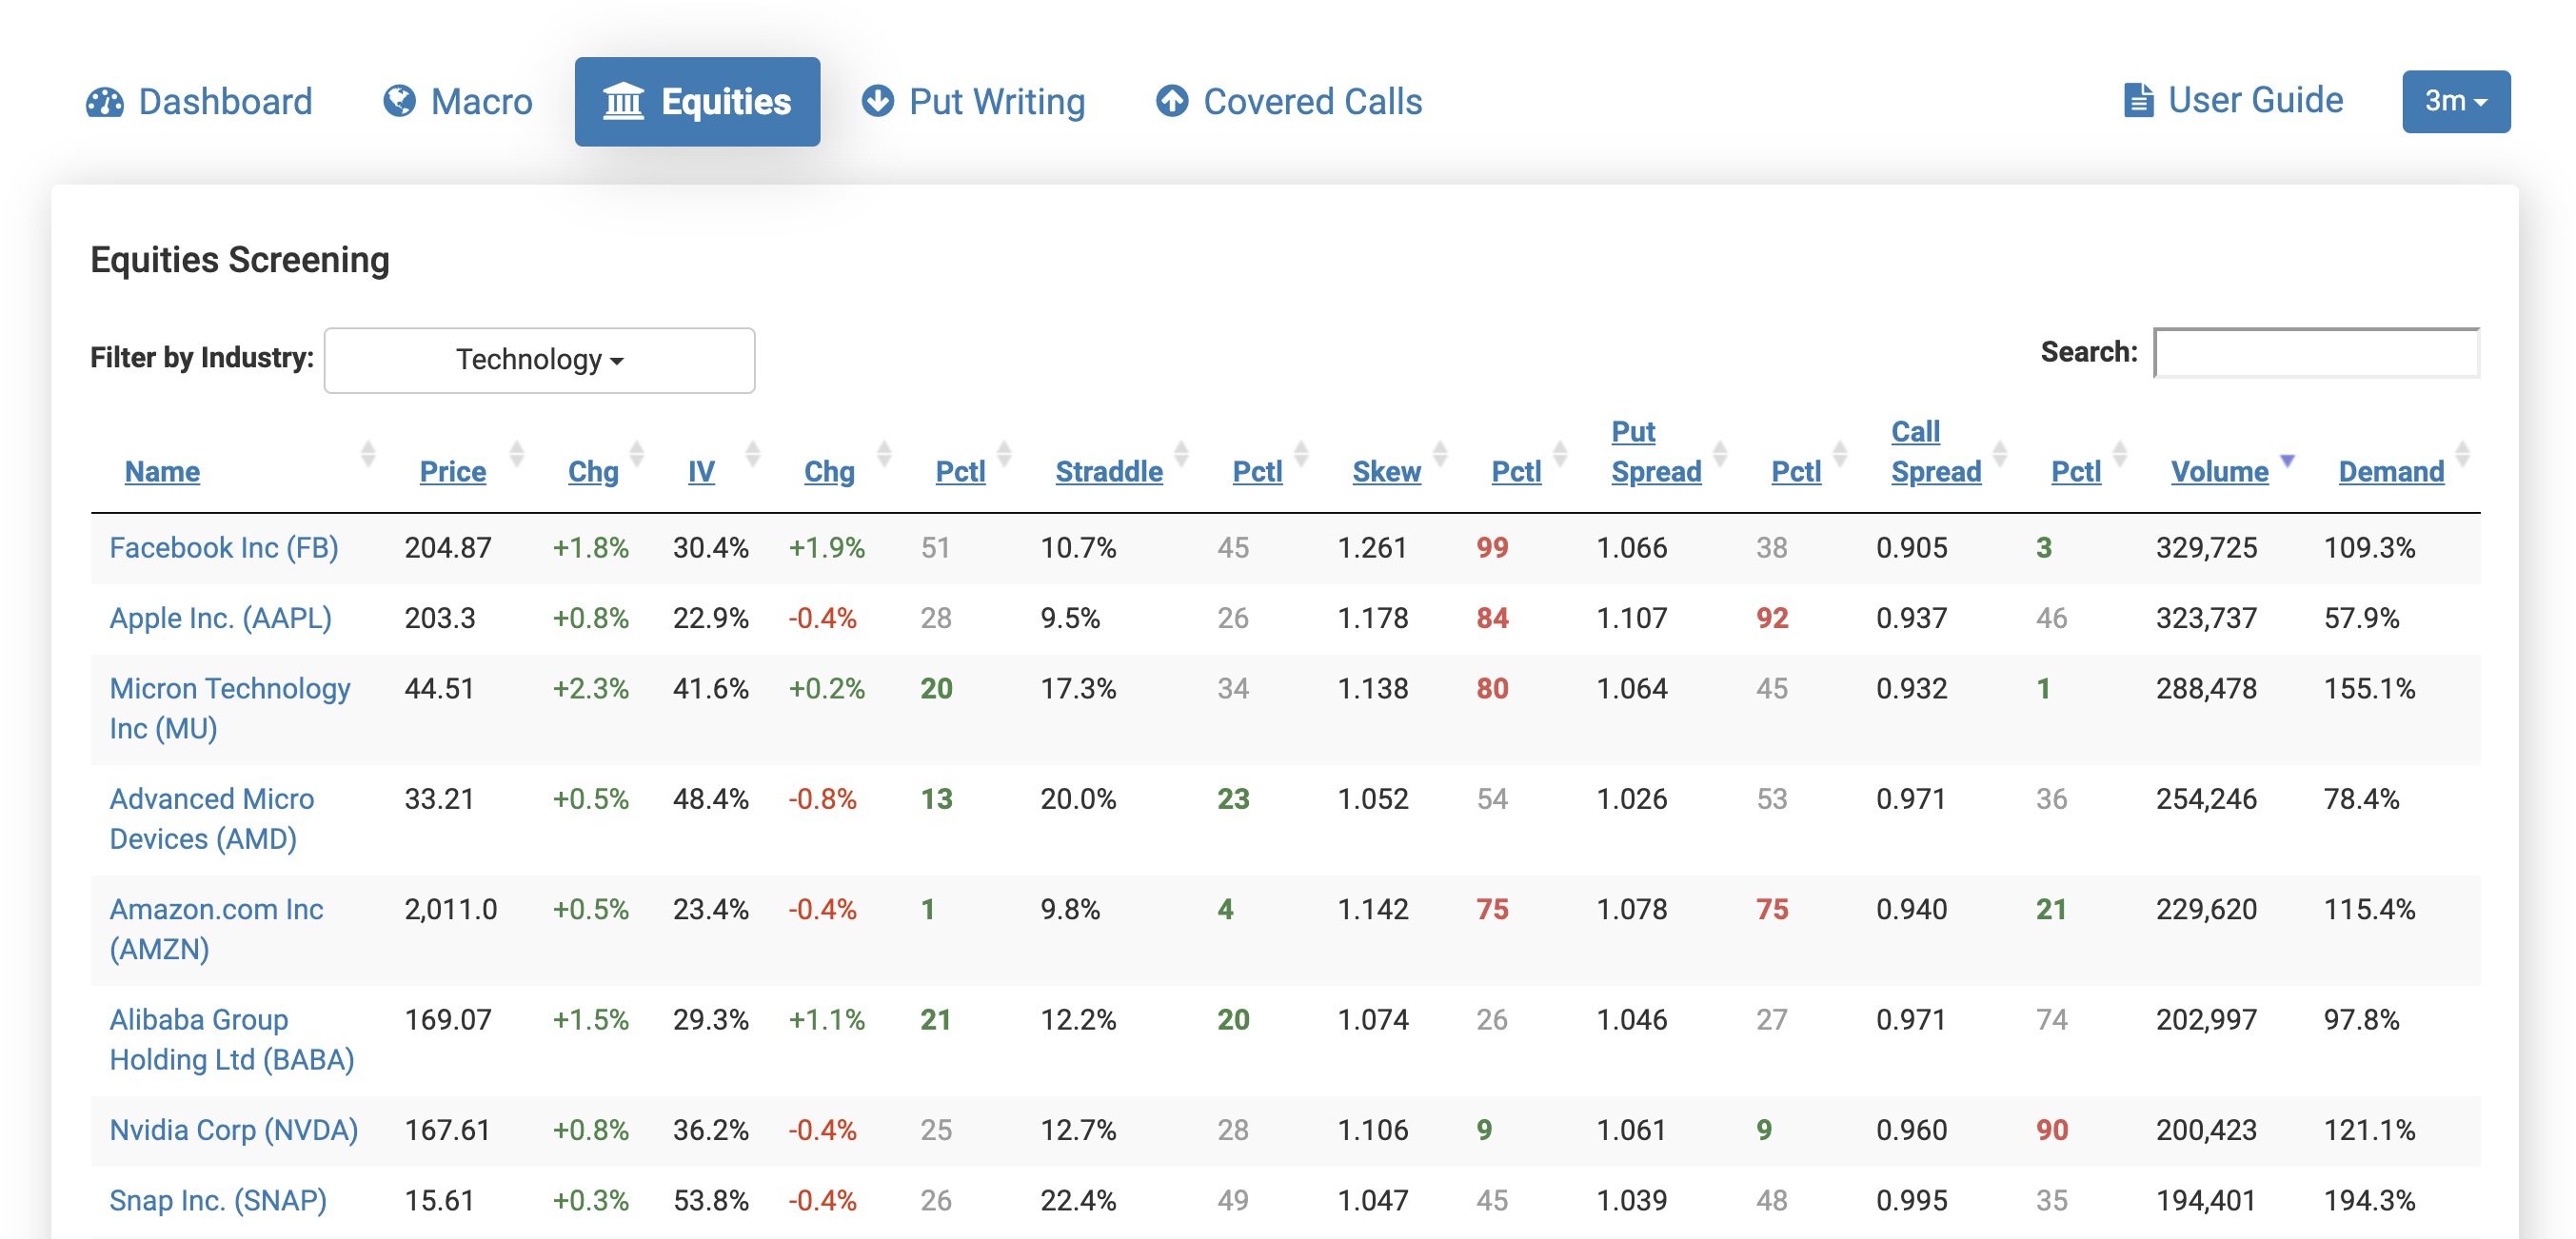
These screens include underlying prices and their day-over-day changes, implied volatilities and their day-over-day changes, current straddle cost as a percentage of the underlying’s price, skew, put spread skew, call spread skew, volume, and a demand metric. Hover over the column headers for each metric to learn more about them and how to use them to improve trading decisions. Directly to the right of each option metric is a percentile column which shows you whether that particular metric is cheap or expensive relative to its history.
Each column is sortable by clicking on the column’s headers. You can also sort by multiple columns by holding down the shift key when clicking on the headers. This allows you to quickly slice and dice all of these option metrics to suit your needs. For example, in just a few clicks, you can find the cheapest straddles to buy across U.S. stocks or the most historically expensive put spreads to sell.
These tools will show option data for three-month expiration dates by default. You can change this to other expirations by clicking on the dropdown in the top right of the page.