Implied Volatility Conditions
Options traders often trade different strategies at different implied volatility (IV) levels. A covered call or put writer might only choose to sell options when implied volatility is greater than a certain percentage value or greater than a certain percentile over the last year. Implied volatility entry and exit conditions allow you to backtest and optimize these types of strategies quickly.
IV Percentile Conditions
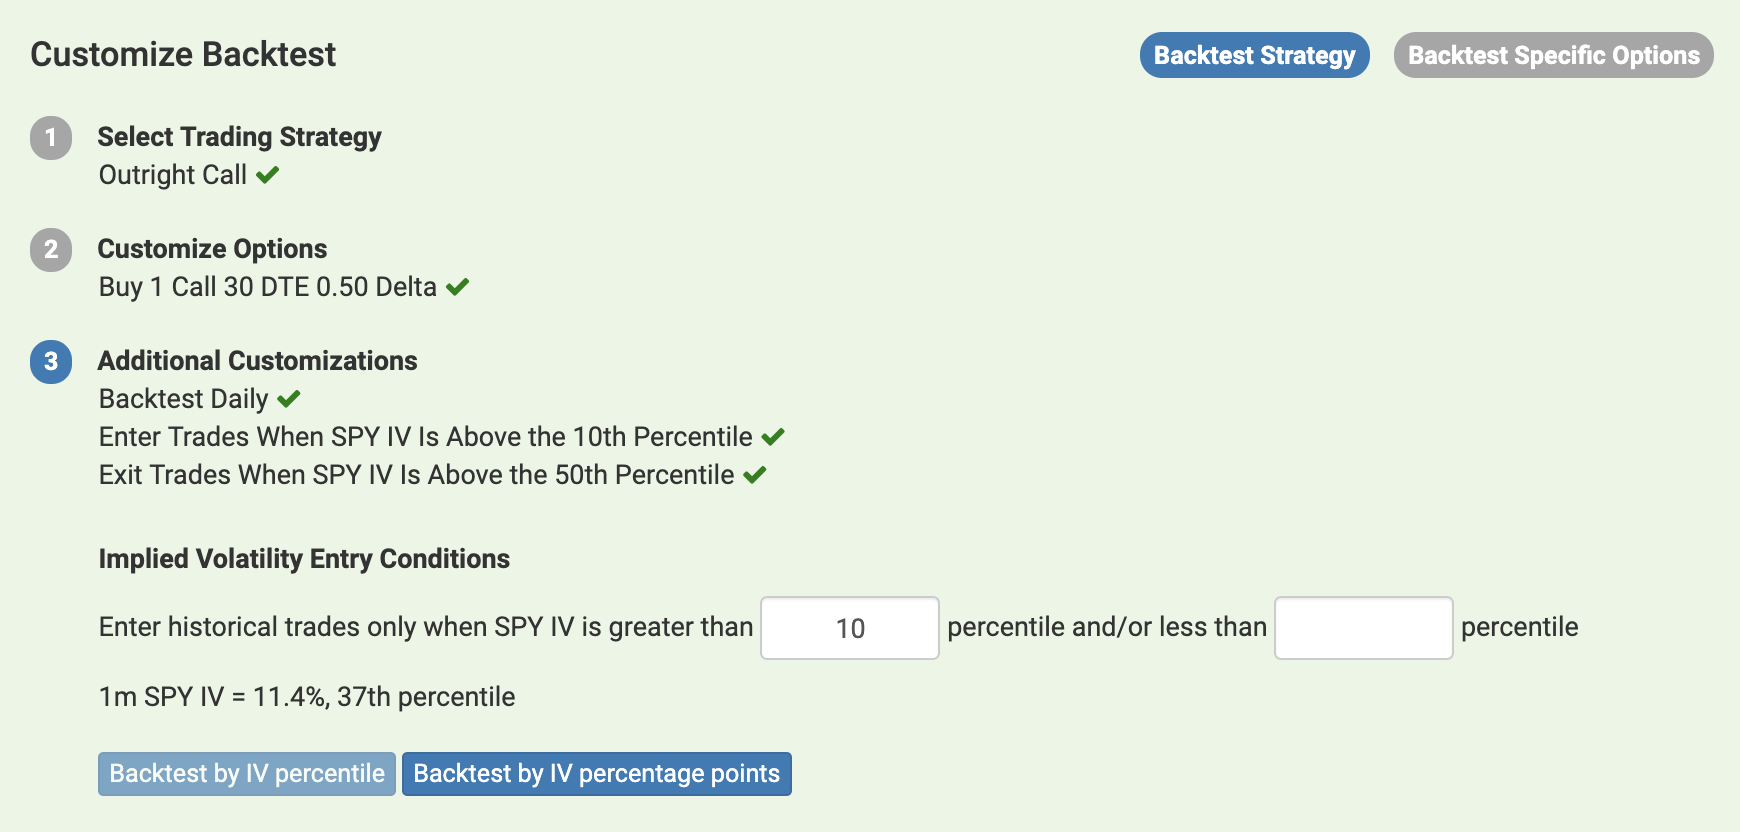
The screenshot below shows the Implied Volatility Entry Conditions available for your backtests. For reference, the tool shows you the prevailing implied volatility and percentile levels. Percentiles are calculated using the last year of historical data, and the implied volatility metric is derived from at-the-money options with one month until expiration.
You can choose to backtest entering your strategy only when the prevailing IV percentile is above and/or below a certain value. There is also a corresponding setting for exiting your strategy when certain IV percentiles are reached. For example, you can quickly backtest a strategy where you buy a call option when IV is below the 10th percentile and then sell the option when IV rises to the 50th percentile.
IV Percentage Conditions
Instead of basing your implied volatility condition on percentile values, you can also use the raw percentage of implied volatility. To modify the setting, click the "Backtest by IV percentage points" button, and the input fields will change to reflect percentage point inputs.
IV vs. Realized Volatility Conditions
The Volatility Backtester also includes several backtesting conditions for different implied volatility vs. realized volatility market environments. As an example, traders may sell options when implied volatility is unusually high compared to realized volatility (RV). Implied volatility is a market estimate of future expected volatility, while realized volatility is the historical volatility that has actually occurred in the past. These conditions allow you to flexibly trade IV vs. RV strategies.
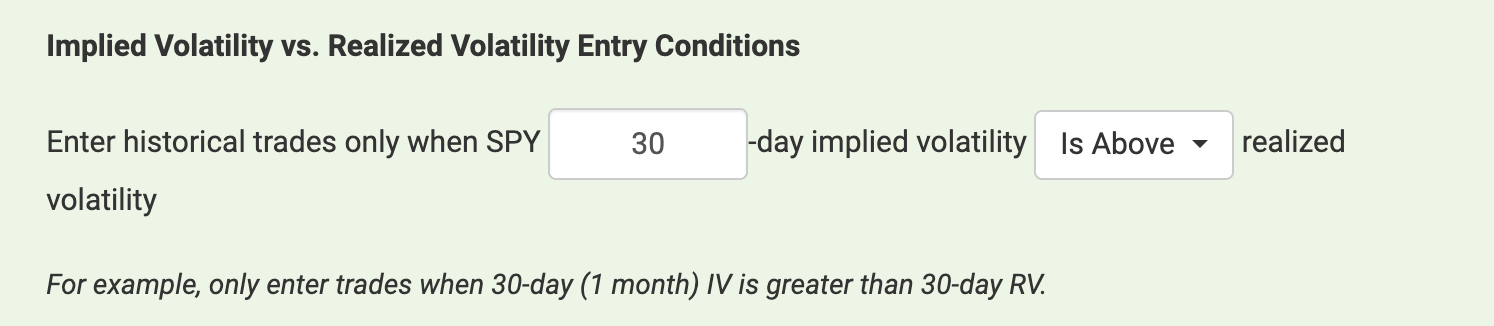
IV vs. RV Relationships
You can choose to only enter historical trades in the backtest when a custom period of implied volatility (for example, 30 days) crosses above, crosses below, is above, or is below the same corresponding period of historically realized volatility.
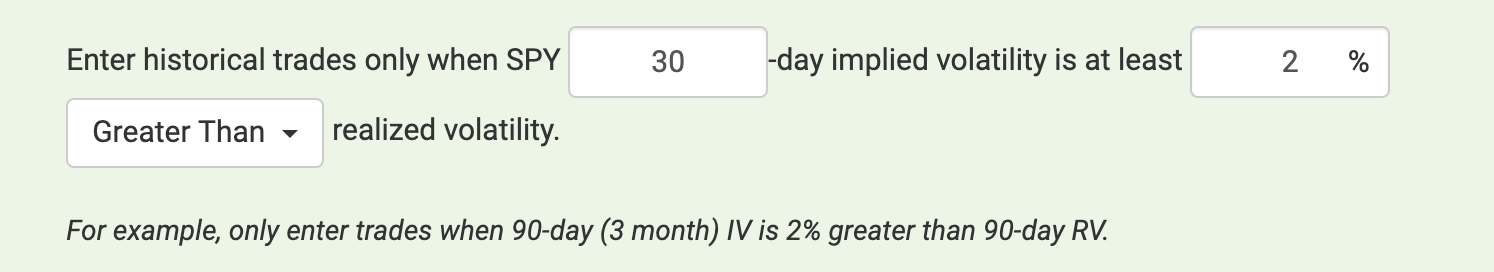
IV vs. RV Differences
You can choose to only enter historical trades in the backtest when a custom period of implied volatility (for example, 30 days) is a certain amount greater or less than the same corresponding period of realized volatility.
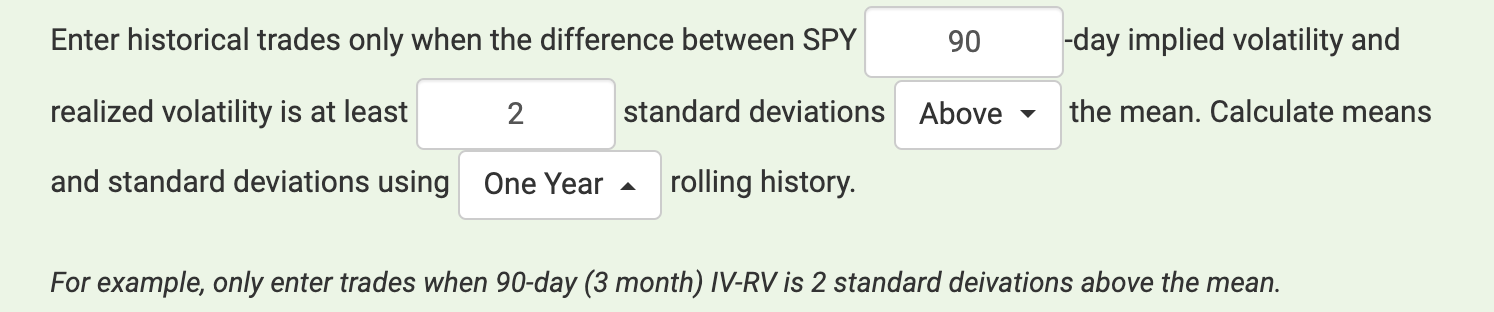
IV vs. RV Standard Deviations
You can choose to only enter historical trades in the backtest when the difference between a custom period of implied volatility (for example, 30 days) and realized volatility of the same period is a certain number of standard deviations above or below the mean.