Volatility User Guide

Volatility User Guide

  • User Guide
  • Video Tour
  • Get Started

›Market Screening

Getting Started

  • Overview
  • Creating Your Account

Options Backtesting

  • Starting Your Backtest
  • Customizing Your Strategy

    • Profit Targets and Stop Losses
    • Implied Volatility Conditions
    • Options Price Conditions
    • Timing and Date Range
    • Holding Periods
    • Technical Indicators
    • Execution and Liquidity Costs
    • Pair with Underlying Shares
    • Earnings Announcements
    • Delta Hedging

    Analyzing Your Results

    • Backtesting Statistics
    • Backtesting Charts
    • Scenario Risk Analysis
    • Strategy Optimization
  • Portfolio Backtesting
  • Backtest Specific Options

Market Screening

  • Volatility Dashboard
  • Macro and Equities Screens
  • Put Writing Screen
  • Covered Call Screen
  • Unusual Options Activity
  • Opportunities Search
  • Correlation Analysis

Options Charting

  • Implied Volatility Charting
  • Volatility Skew Charting
  • Volatility Surface Charting
  • Market Positioning Charting
  • Put/Call Volume Charting

Account Management

  • Settings
  • Transactions
  • Password

Miscellaneous

  • Start Bar

Correlation Analysis

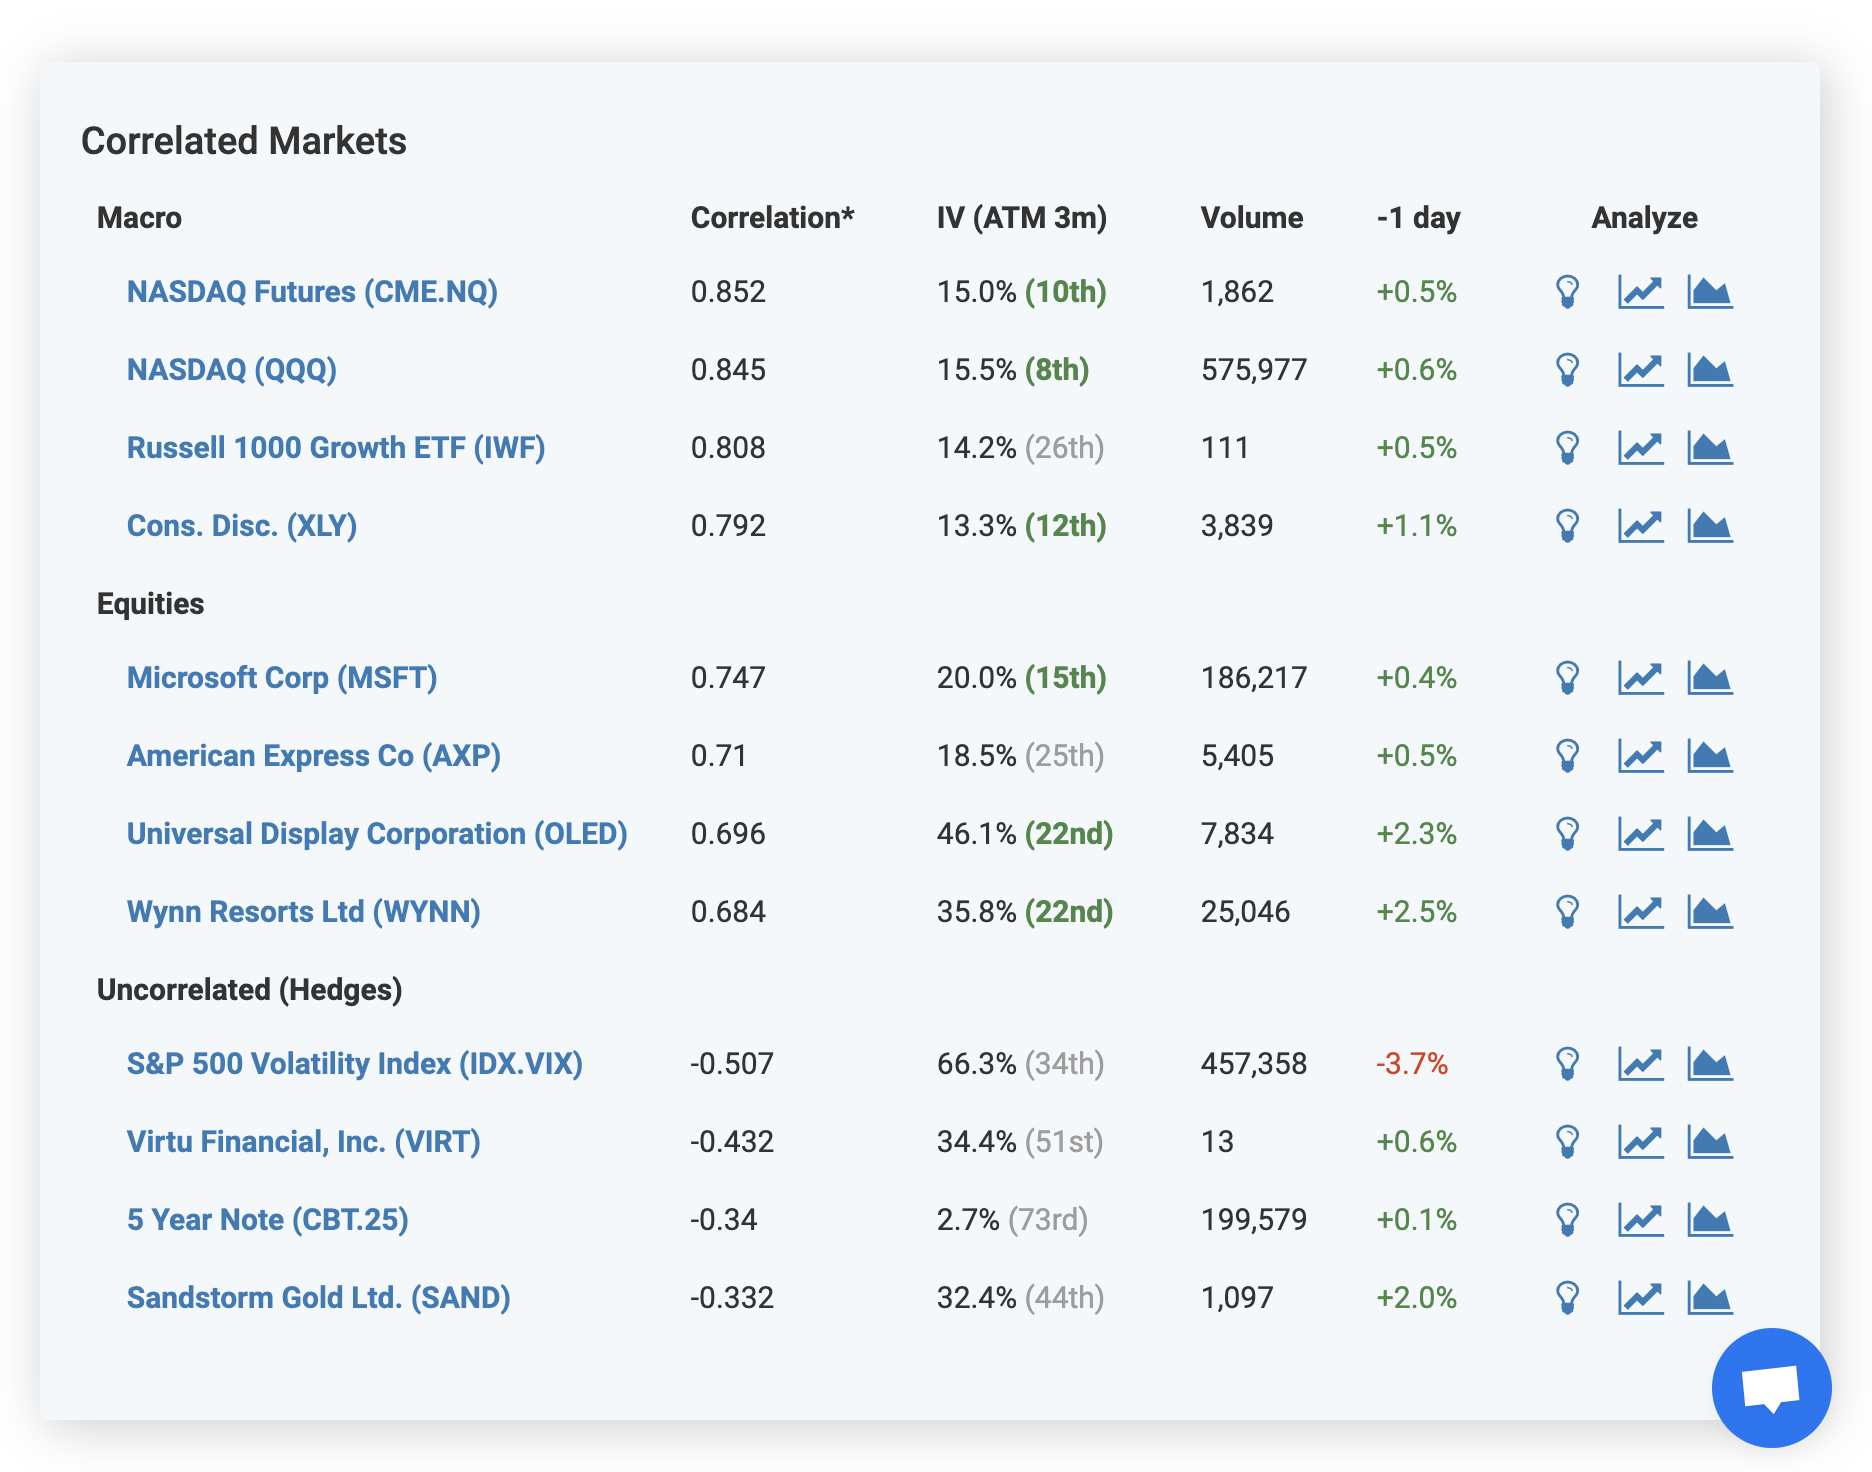
Volatility maintains a large correlation database and provides you with key data from it to improve your trading decisions. Correlation measures the degree to which two stocks move together. On each market’s Opportunities page, Volatility shows the top four macro and equity markets that are positively correlated with it. This is particularly useful for finding other markets that provide similar risk exposures at much more attractive pricing.

For example, if you’re looking to sell a strangle on the S&P 500 (SPY) and see in the Correlated Markets section that the Dow Jones (DIA) has a 0.90 correlation with much higher implied volatility and higher option premiums, you may opt to sell your strangle on DIA instead. You can further leverage the Volatility platform to backtest both trading ideas to find the one that’s right for you.

In the Correlated Markets section, Volatility also displays uncorrelated markets which could make for effective hedges on the current asset. Be sure to check here for the cheapest and most effective hedging opportunities if you’re looking to purchase protection on an asset.

Correlated Markets Screenshot

← Opportunities SearchImplied Volatility Charting →
Products
BacktestingScreeningCharting
Resources
Backtesting ResearchBlogPricing
Follow @getvolatility
Use of this site constitutes acceptance of our Terms and Conditions and Privacy Policy.
Copyright © 2019 Volatility Analytics Inc. All rights reserved.