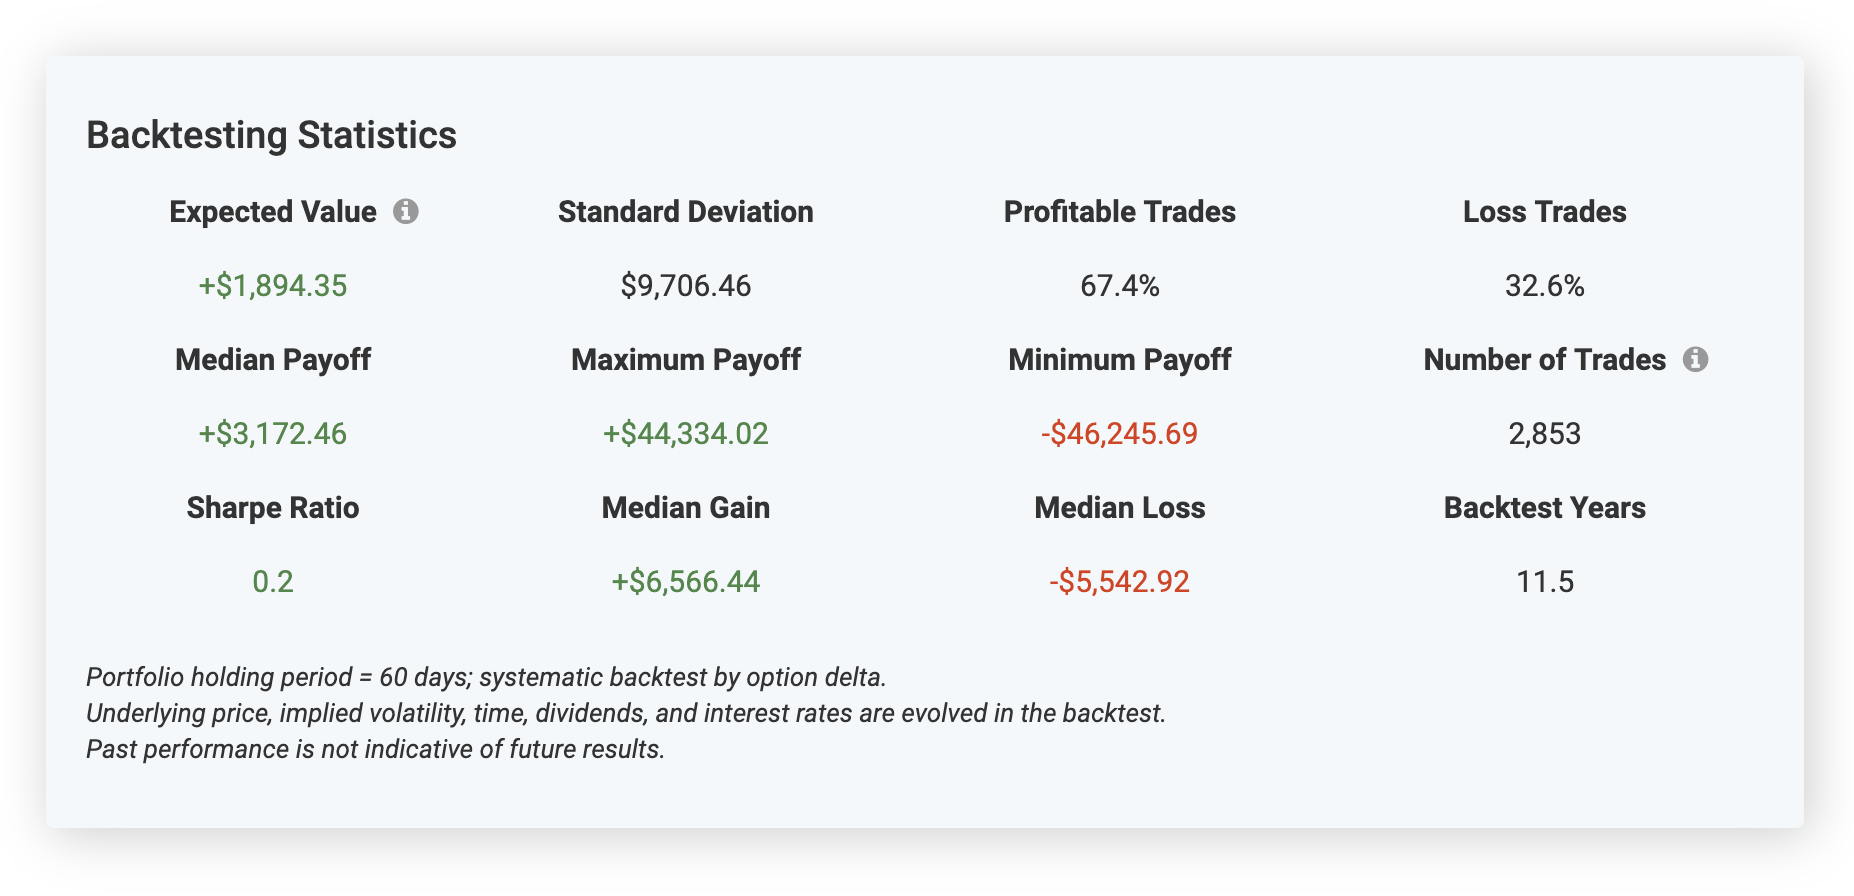
Backtesting Statistics
The Backtesting Statistics provide you with a holistic overview of how your strategy would have performed in the past.
The Expected Value shows you the average return across all of the trades in your backtest. For example, if you were backtesting a three month bull call spread, an expected value of +$1,000 would tell you that on average, the strategy made $1,000 every three months over the historical period of your backtest.
Backtesting Statistics also includes the median payoff, maximum payoff, minimum payoff, standard deviation, percentage of profitable trades, median gain, median loss, Sharpe ratio, and the number of years and number of trades included in the backtest. All of these statistics are calculated using each individual trade in your backtest. Depending on your backtest’s complexity, this can often include thousands of trades. The statistics are not annualized.
A common usage pattern is to optimize your inputted strategy parameters such as strike prices, days to expiration, profit targets, and stop losses. Tweaking these inputs and re-running your backtest and then reviewing the changes to the Backtesting Statistics can help you quickly find improvements to your strategy to maximize returns and minimize risk.