Options backtesting equity curves and histograms
18 Jul 2016We’re announcing today the addition of equity curves and histograms to our options backtesting results to help you better evaluate and uncover attractive trading strategies.
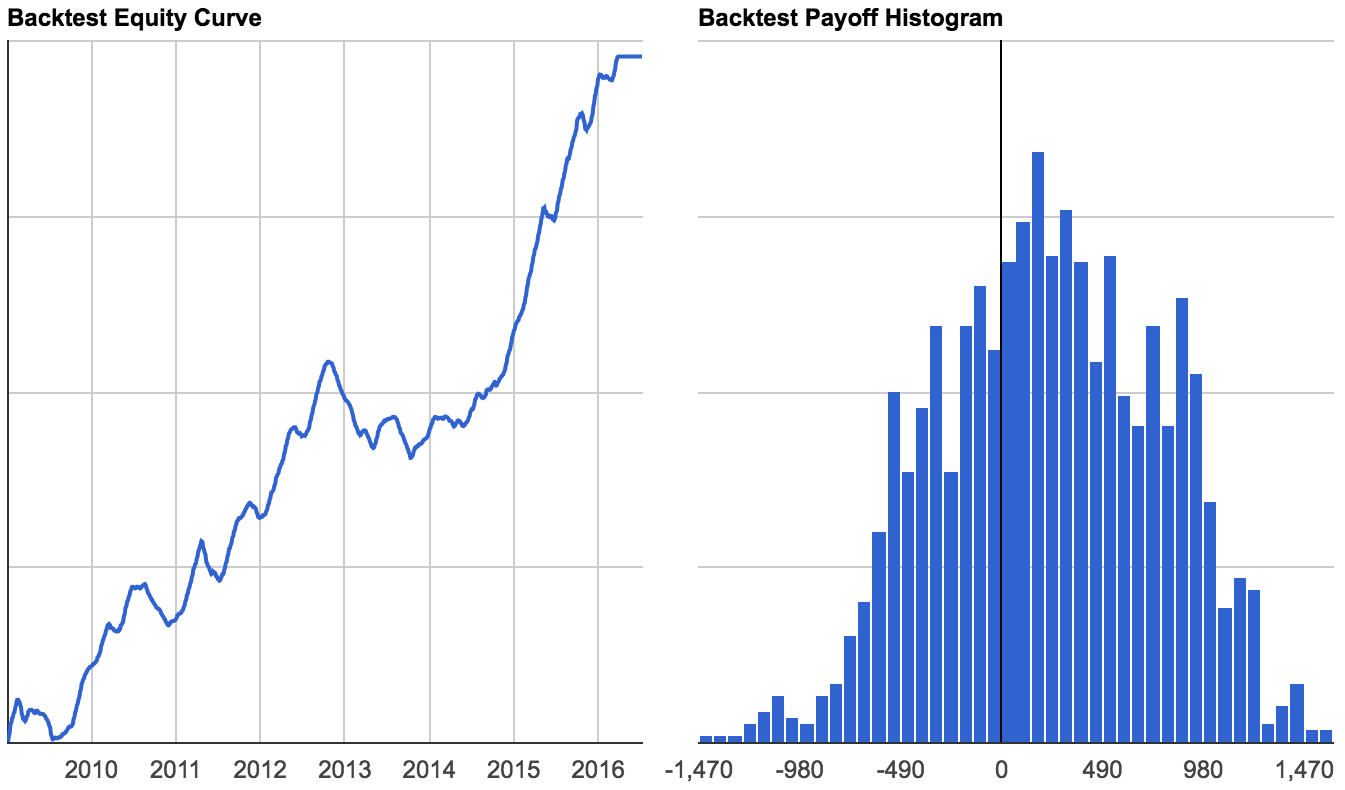
Our equity curves show cumulative profit/loss for your options backtest and make it even easier to understand your strategy’s historical returns and drawdowns through time. In seconds, you can understand the net trend of your options strategy and whether it would have been profitable historically.
Backtest histograms show the frequency distribution of outcomes to help you quickly discern the historical probabilities of specific profit/loss events. This helps you easily visualize tail events and understand whether your strategy’s historical returns are clustered around certain levels.
Together, these two new backtesting features will help you swiftly optimize and discover options strategies on Volatility.